


XRP price started a recovery wave above $2.10. The price is now showing a few positive signs but might struggle to clear the $2.220 resistance.
- XRP price started a recovery wave above the $2.10 zone.
- The price is now trading below $2.120 and the 100-hourly Simple Moving Average.
- There was a break above a bearish trend line with resistance at $2.080 on the hourly chart of the XRP/USD pair (data source from Kraken).
- The pair could continue to move up if it settles above $2.220.
XRP Price Eyes Steady Increase
XRP price remained supported above $2.020 and started a recovery wave, like Bitcoin and Ethereum. The price was able to climb above $2.080 and $2.10 to enter a short-term positive zone.
There was also a move above the 23.6% Fib retracement level of the downward move from the $2.416 swing high to the $2.034 low. Besides, there was a break above a bearish trend line with resistance at $2.080 on the hourly chart of the XRP/USD pair.
The price is now trading above $2.120 and the 100-hourly Simple Moving Average. If there is a fresh upward move, the price might face resistance near the $2.220 level. It coincides with the 50% Fib retracement level of the downward move from the $2.416 swing high to the $2.034 low.
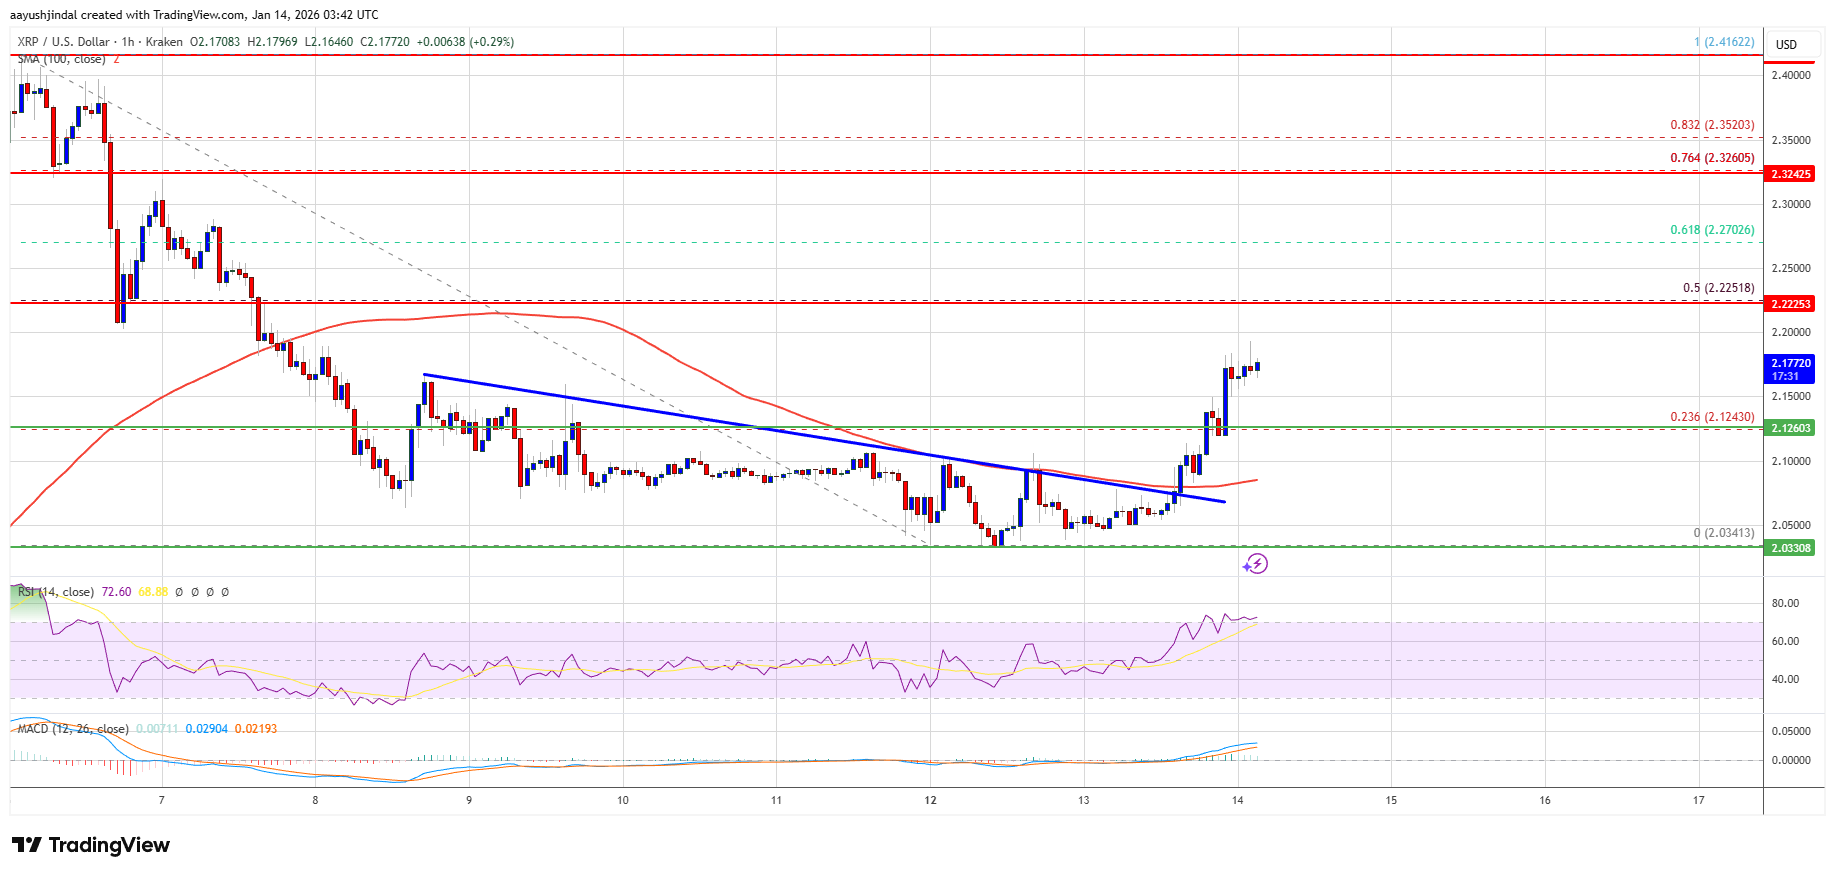
The first major resistance is near the $2.250 level. A close above $2.250 could send the price to $2.320. The next hurdle sits at $2.350. A clear move above the $2.350 resistance might send the price toward the $2.40 resistance. Any more gains might send the price toward the $2.420 resistance. The next major hurdle for the bulls might be near $2.450.
Another Drop?
If XRP fails to clear the $2.220 resistance zone, it could start a fresh decline. Initial support on the downside is near the $2.120 level. The next major support is near the $2.10 level.
If there is a downside break and a close below the $2.10 level, the price might continue to decline toward $2.050. The next major support sits near the $2.020 zone, below which the price could continue lower toward $2.00.
Technical Indicators
Hourly MACD – The MACD for XRP/USD is now losing pace in the bearish zone.
Hourly RSI (Relative Strength Index) – The RSI for XRP/USD is now above the 50 level.
Major Support Levels – $2.10 and $2.050.
Major Resistance Levels – $2.220 and $2.250.


+ There are no comments
Add yours