


Bitcoin price extended losses and traded below $88,500. BTC is consolidating losses and might attempt a recovery wave if it clears $88,500.
- Bitcoin started a minor recovery wave from the $86,000 level.
- The price is trading below $88,200 and the 100 hourly Simple moving average.
- There is a new bearish trend line forming with resistance at $88,000 on the hourly chart of the BTC/USD pair (data feed from Kraken).
- The pair might recover if it manages to settle above $86,200 and $86,000.
Bitcoin Price Dips Further
Bitcoin price failed to stay above the $89,000 support and extended losses. BTC declined sharply below the $88,500 and $87,000 support levels.
The bears even pushed the price below $86,500. A low was formed at $86,007, and the price is now attempting a recovery wave. There was a move above the 23.6% Fib retracement level of the downward move from the $91,099 swing high to the $86,007 low.
Bitcoin is now trading below $88,500 and the 100 hourly Simple moving average. If the price remains stable above $86,500, it could attempt a fresh increase. Immediate resistance is near the $88,000 level. There is also a new bearish trend line forming with resistance at $88,000 on the hourly chart of the BTC/USD pair.
The first key resistance is near the $88,500 level since it is close to the 50% Fib retracement level of the downward move from the $91,099 swing high to the $86,007 low.
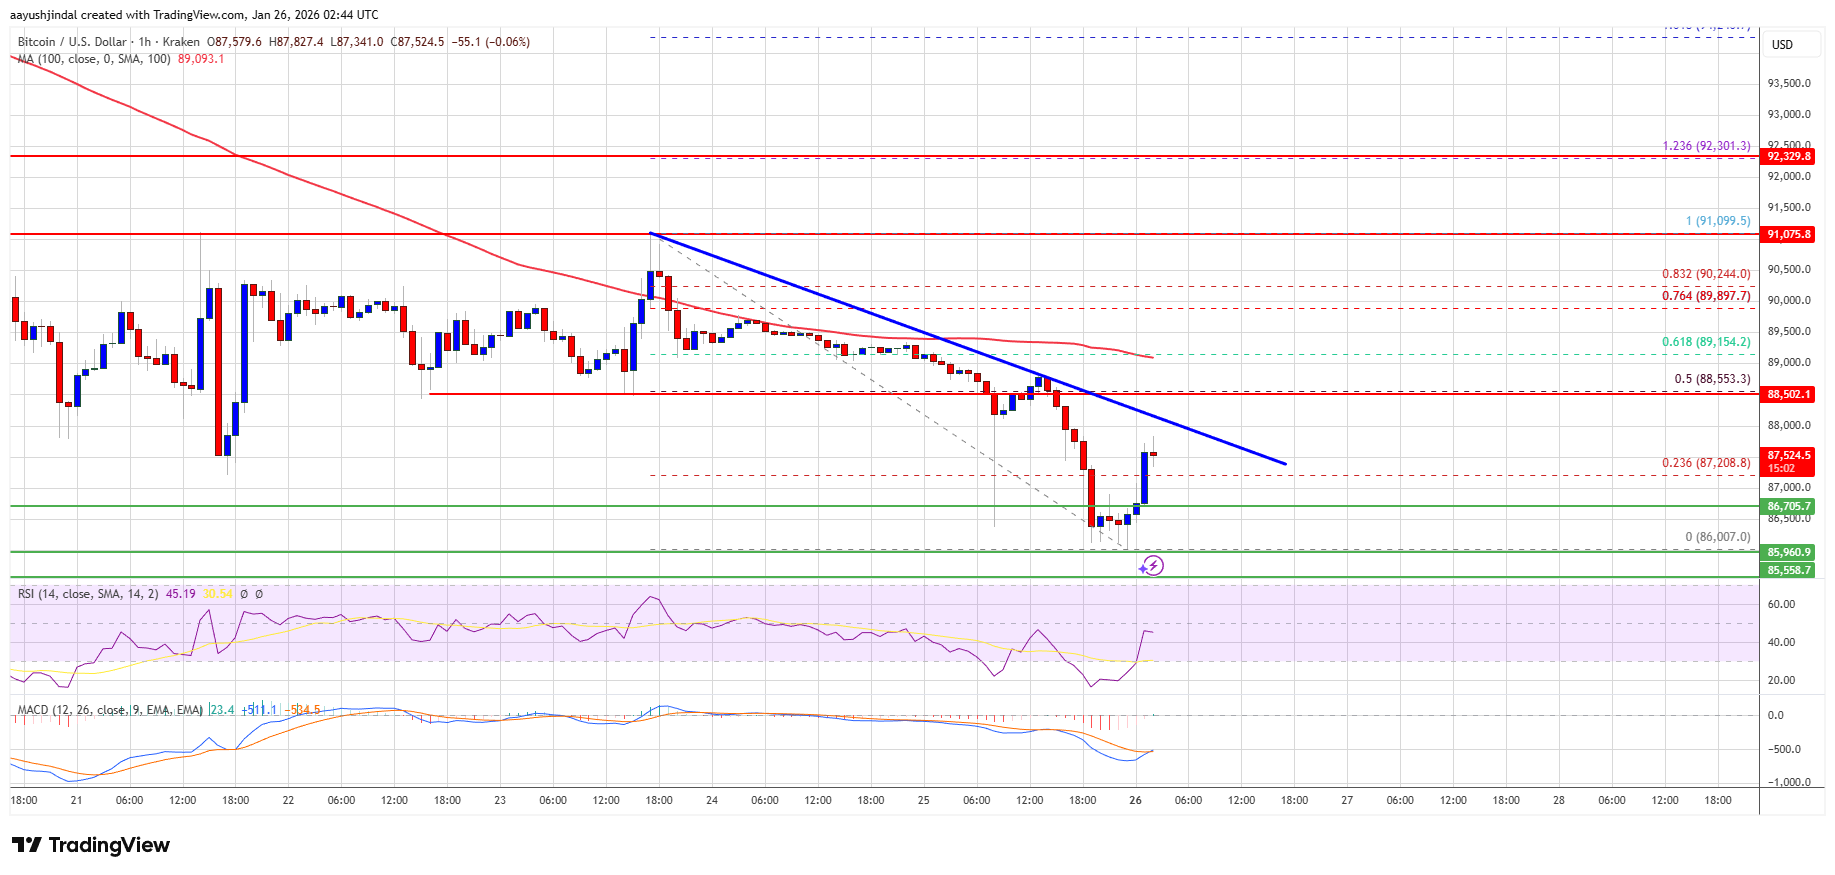
A close above the $88,500 resistance might send the price further higher. In the stated case, the price could rise and test the $89,200 resistance. Any more gains might send the price toward the $90,000 level. The next barrier for the bulls could be $91,000 and $91,500.
More Losses In BTC?
If Bitcoin fails to rise above the $88,500 resistance zone, it could start another decline. Immediate support is near the $86,700 level. The first major support is near the $86,200 level.
The next support is now near the $85,500 zone. Any more losses might send the price toward the $83,500 support in the near term. The main support sits at $82,500, below which BTC struggle to recover in the near term.
Technical indicators:
Hourly MACD – The MACD is now losing pace in the bearish zone.
Hourly RSI (Relative Strength Index) – The RSI for BTC/USD is now below the 50 level.
Major Support Levels – $86,700, followed by $86,000.
Major Resistance Levels – $88,500 and $89,200.


+ There are no comments
Add yours