


A cryptocurrency analyst has pointed out how Cardano has formed a technical analysis (TA) signal on its weekly chart that last led into a major price drawdown.
Cardano SuperTrend Has Flipped Bearish
In a new post on X, analyst Ali Martinez has talked about a signal that has appeared in the SuperTrend of Cardano. The “SuperTrend” refers to a TA indicator that’s generally used for determining whether a given asset is following a bearish or bullish trend. It’s built using the Average True Range (ATR), another TA indicator that measures the degree of volatility being experienced by the price.
The SuperTrend is represented by a single trendline that acts as both support and resistance, depending on which side the asset is trading. When the price is above this line, the indicator signals that the asset is in a bullish trend. On the other hand, being under the line implies the dominance of a bearish trajectory.
Now, here is the chart shared by Martinez that shows the trend in the SuperTrend of Cardano over the last few years:
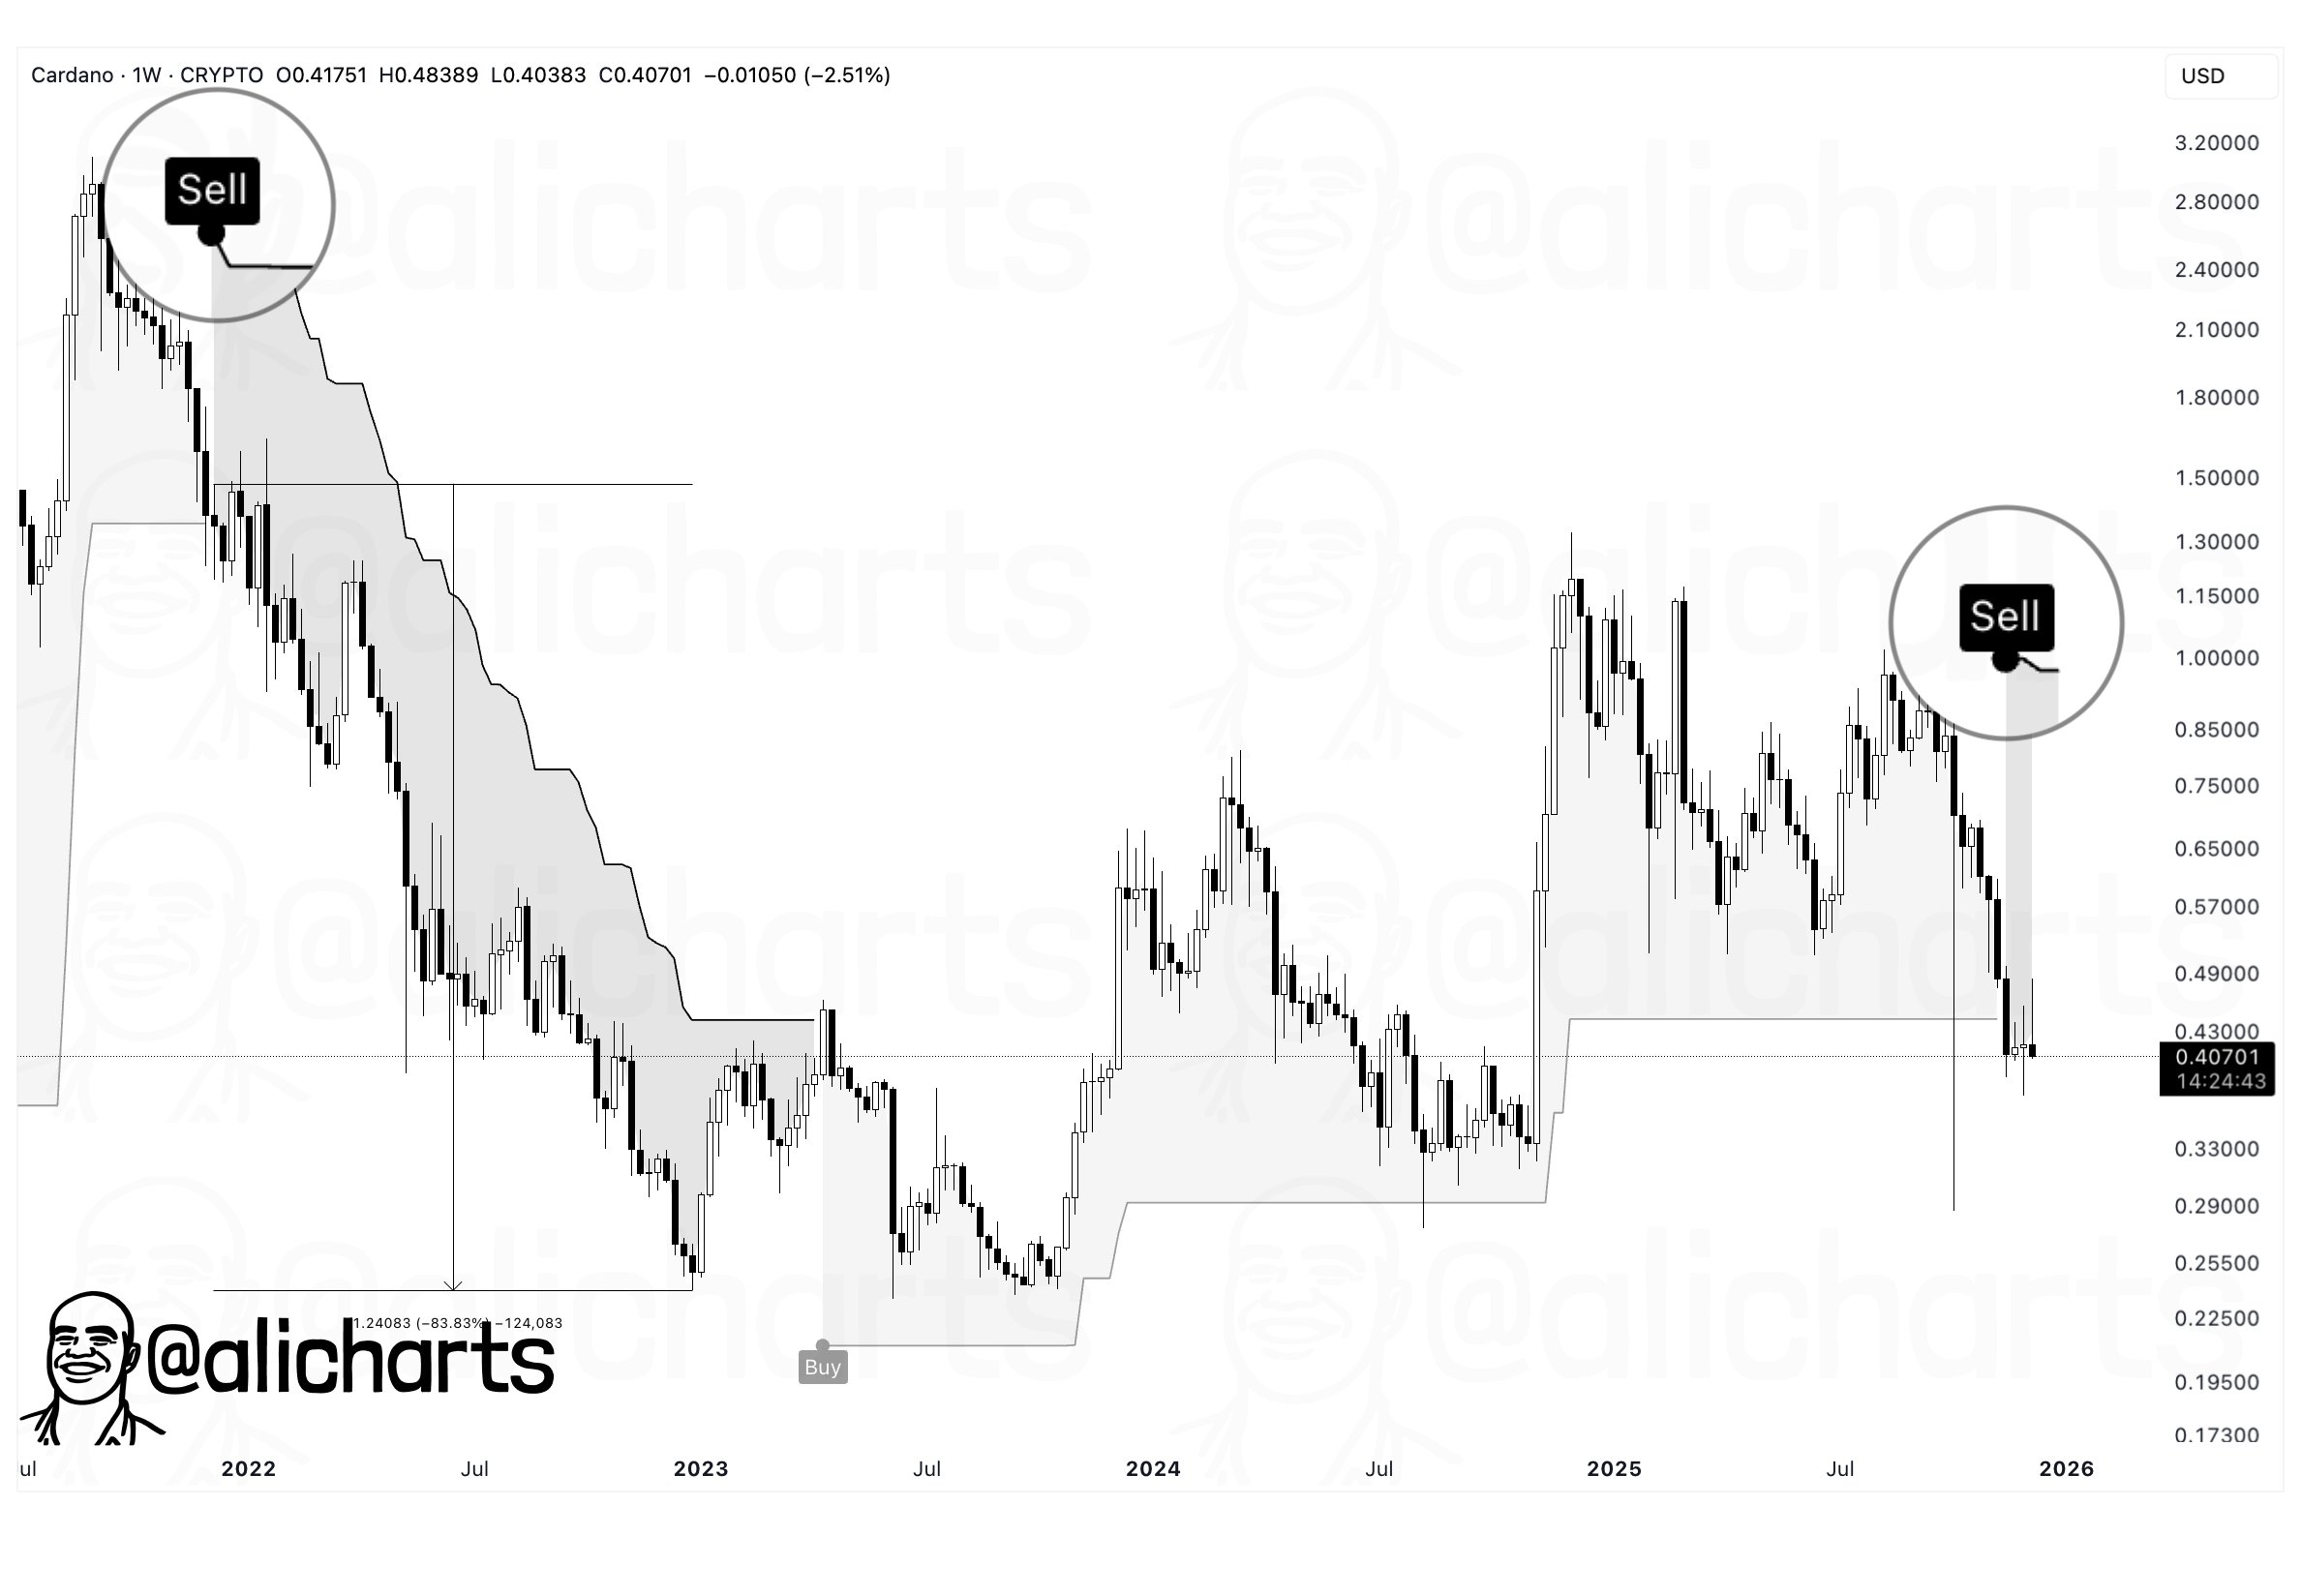
As displayed in the above graph, the weekly Cardano price broke above the SuperTrend line during 2023 and stayed over it throughout 2024 and much of 2025. Recently, however, the price has finally seen a reversal of trend, with the indicator now giving a bearish signal instead.
In the chart, Martinez has highlighted what happened the last time that this pattern developed in ADA’s 1-week price. It would appear that the flip to a bearish trend led to a decline of more than 80% for the cryptocurrency in 2022. It now remains to be seen whether the SuperTrend giving a sell signal is foreshadowing something similar this time, or if Cardano will see the renewal of bullish momentum despite the pattern.
Cardano isn’t the only coin in the sector that has seen a flip in the SuperTrend recently. As the analyst has highlighted in another X post, the number one cryptocurrency, Bitcoin, has also seen a change in its SuperTrend.

From the above chart, it’s apparent that the weekly price of Bitcoin is now trading under the SuperTrend line, a sign that a bearish trend is taking over. Like for Cardano, the last time this flip happened was in the last bear market. Back then, BTC dropped by over 60%.
ADA Price
Cardano saw brief recovery above $0.48 last week, but the cryptocurrency has since witnessed a retrace as its price is now back at $0.40.


+ There are no comments
Add yours