


Solana started a fresh increase above the $135 zone. SOL price is now consolidating above $142 and might aim for more gains above the $145 zone.
- SOL price started a fresh upward move above the $135 and $140 levels against the US Dollar.
- The price is now trading above $140 and the 100-hourly simple moving average.
- There is a bullish trend line forming with support at $143 on the hourly chart of the SOL/USD pair (data source from Kraken).
- The pair could extend gains if it clears the $145 resistance zone.
Solana Price Gains Momentum
Solana price started a decent increase after it settled above the $128 zone, like Bitcoin and Ethereum. SOL climbed above the $135 level to enter a short-term positive zone.
The price even smashed the $140 resistance. The bulls were able to push the price above $142. The price is now consolidating gains above the 23.6% Fib retracement level of the recent upward move from the $123 swing low to the $146 high.
Solana is now trading above $140 and the 100-hourly simple moving average. Besides, there is a bullish trend line forming with support at $143 on the hourly chart of the SOL/USD pair.
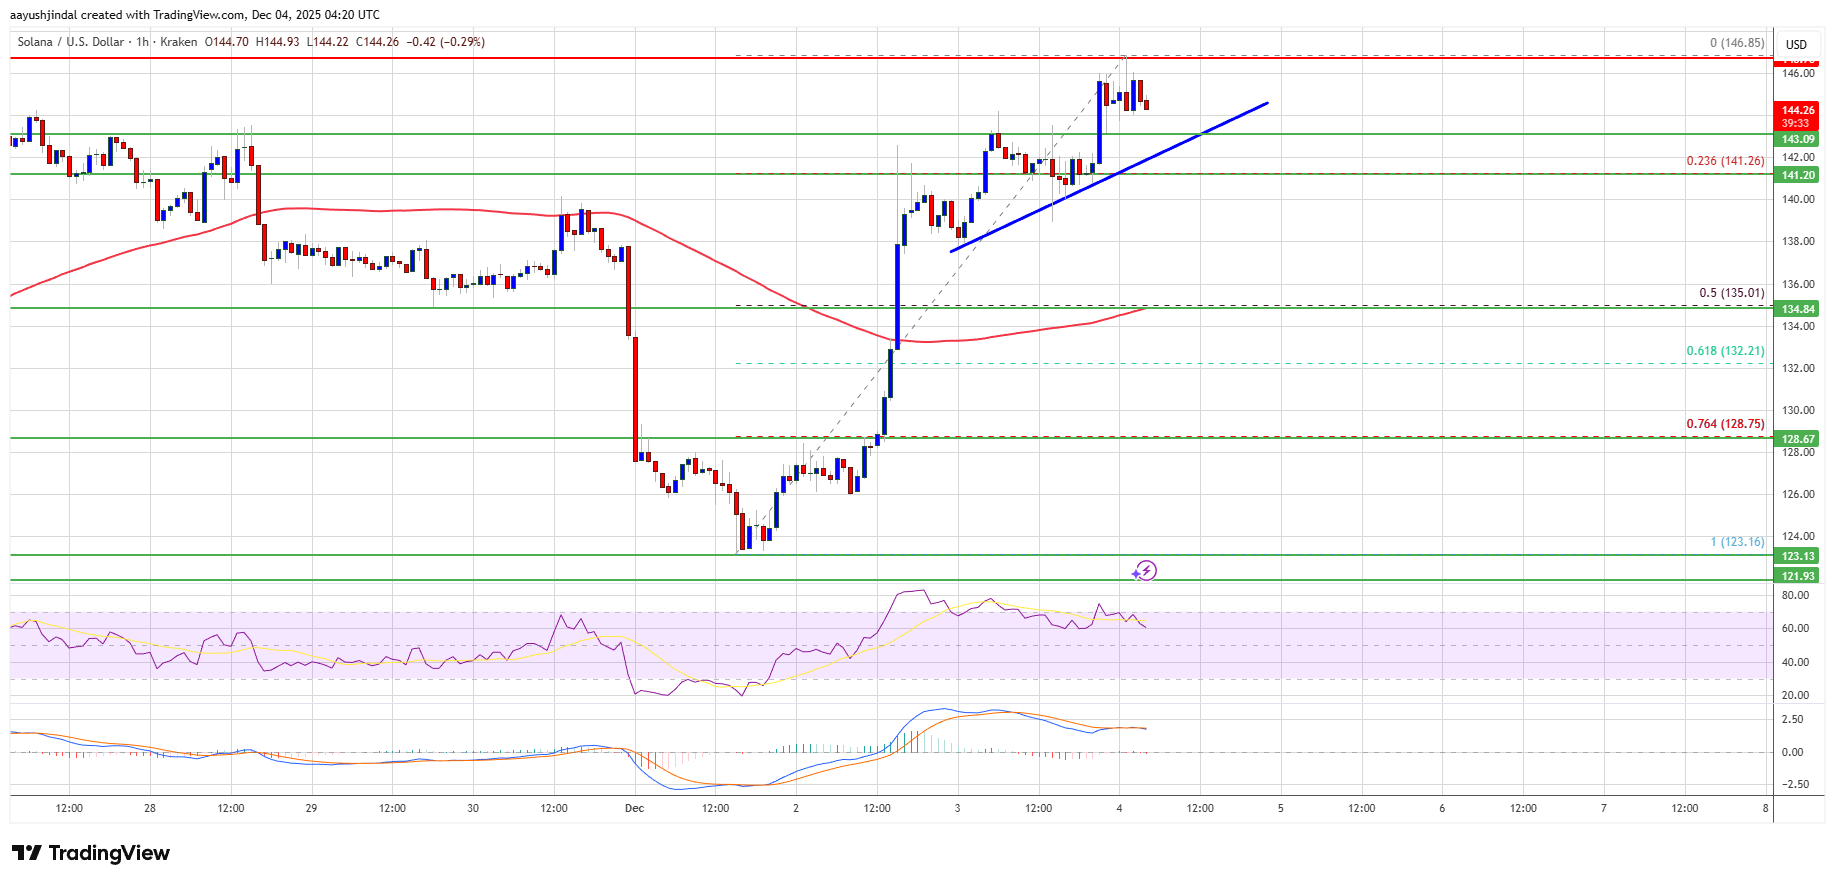
On the upside, the price is facing resistance near $145. The next major resistance is near the $148 level. The main resistance could be $150. A successful close above the $150 resistance zone could set the pace for another steady increase. The next key resistance is $162. Any more gains might send the price toward the $180 level.
Another Pullback In SOL?
If SOL fails to rise above the $145 resistance, it could start another decline. Initial support on the downside is near the $143 zone and the trend line. The first major support is near the $135 level and the 50% Fib retracement level of the recent upward move from the $123 swing low to the $146 high.
A break below the $135 level might send the price toward the $128 support zone. If there is a close below the $128 support, the price could decline toward the $120 support in the near term.
Technical Indicators
Hourly MACD – The MACD for SOL/USD is losing pace in the bullish zone.
Hourly Hours RSI (Relative Strength Index) – The RSI for SOL/USD is above the 50 level.
Major Support Levels – $143 and $135.
Major Resistance Levels – $145 and $150.


+ There are no comments
Add yours