


XRP price started a recovery wave above $2.40. The price is now facing resistance near $2.5350 and at risk of a fresh decline.
- XRP price is moving lower from the $2.5350 zone.
- The price is now trading above $2.40 and the 100-hourly Simple Moving Average.
- There is a connecting bullish trend line forming with support at $2.420 on the hourly chart of the XRP/USD pair (data source from Kraken).
- The pair could start a fresh increase if it clears the $2.5350 resistance.
XRP Price Faces Resistance
XRP price formed a base above $2.20 and started a recovery wave, like Bitcoin and Ethereum. The price surpassed the $2.350 and $2.40 resistance levels.
The bulls were able to push the price above $2.50, and the 50% Fib retracement level of the downward move from the $2.647 swing high to the $2.190 low. However, the bears remained active near the $2.5350 level and prevented more gains.
The price failed to clear the 76.4% Fib retracement level of the downward move from the $2.647 swing high to the $2.190 low. It is again moving below $2.50. The price is now trading above $2.40 and the 100-hourly Simple Moving Average. Besides, there is a connecting bullish trend line forming with support at $2.420 on the hourly chart of the XRP/USD pair.
If there is a fresh upward move, the price might face resistance near the $2.480 level. The first major resistance is near the $2.50 level, above which the price could rise and test $2.5350.
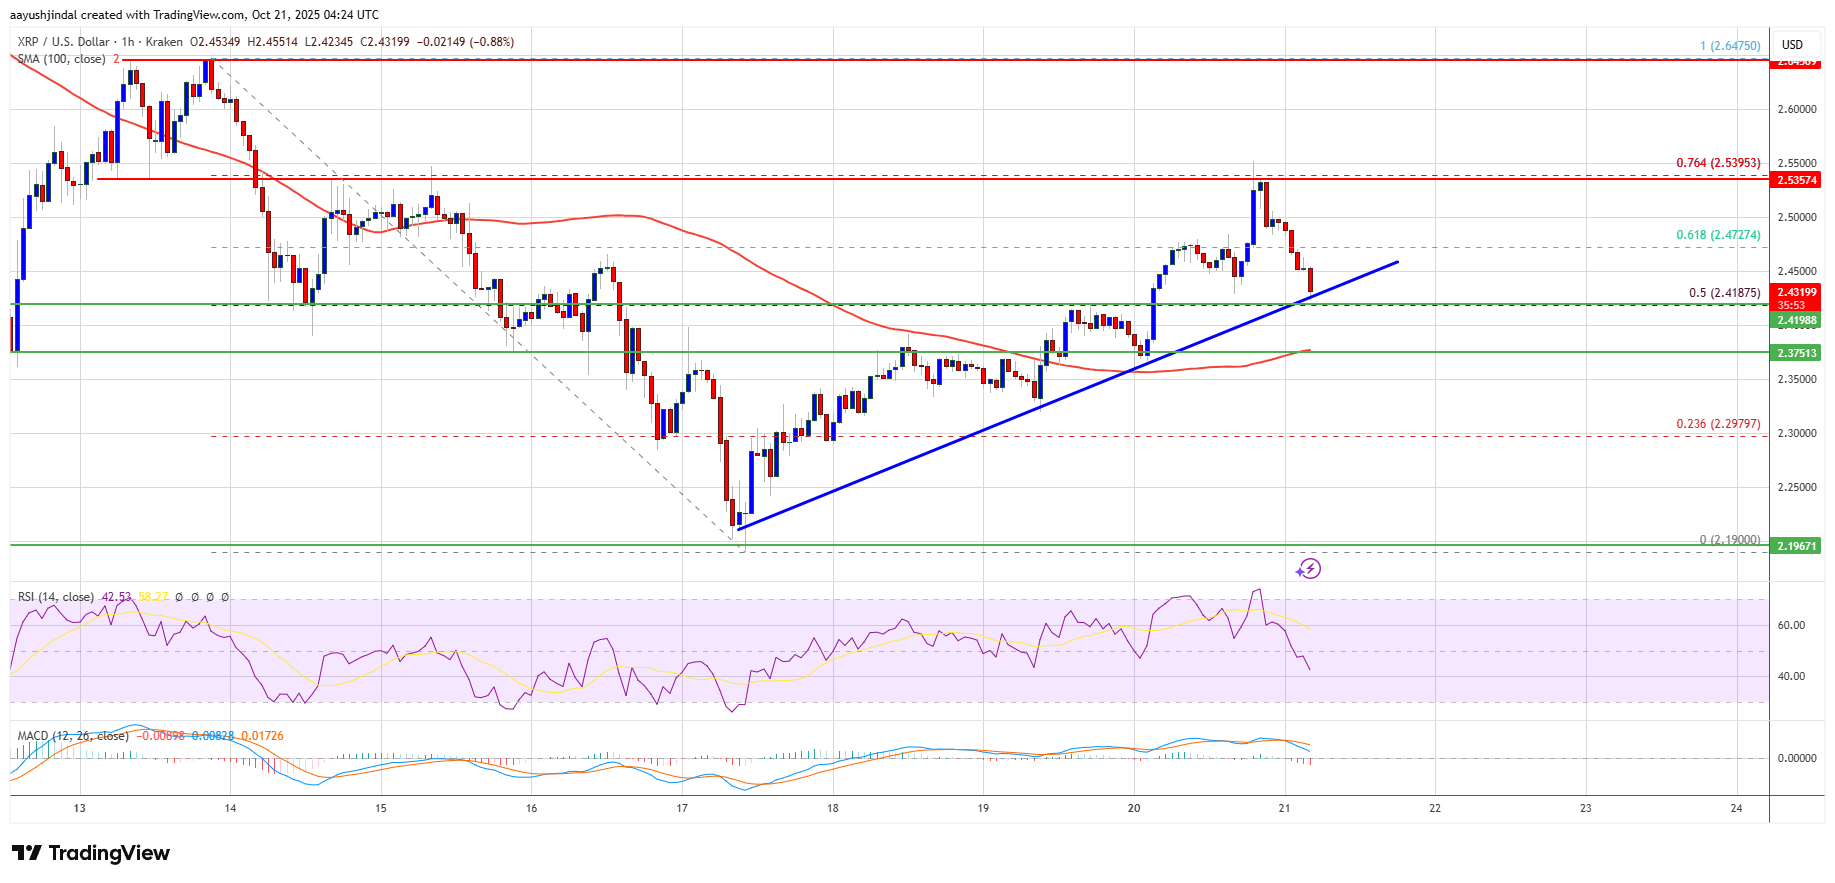
A clear move above the $2.5350 resistance might send the price toward the $2.580 resistance. Any more gains might send the price toward the $2.650 resistance. The next major hurdle for the bulls might be near $2.720.
Another Drop?
If XRP fails to clear the $2.50 resistance zone, it could start a fresh decline. Initial support on the downside is near the $2.420 level. The next major support is near the $2.40 level.
If there is a downside break and a close below the $2.40 level, the price might continue to decline toward $2.350. The next major support sits near the $2.320 zone, below which the price could continue lower toward $2.250.
Technical Indicators
Hourly MACD – The MACD for XRP/USD is now gaining pace in the bearish zone.
Hourly RSI (Relative Strength Index) – The RSI for XRP/USD is now below the 50 level.
Major Support Levels – $2.420 and $2.40.
Major Resistance Levels – $2.50 and $2.5350.


+ There are no comments
Add yours