


On-chain data shows the Bitcoin Exchange Reserve has witnessed a spike recently, a sign that could be bearish for the asset’s price.
Bitcoin Exchange Reserve Has Hit A Multi-Month High
In a new post on X, CryptoQuant community analyst Maartunn has talked about the latest trend in the Exchange Reserve of Bitcoin. The “Exchange Reserve” refers to an on-chain indicator that keeps track of the total amount of the cryptocurrency that is sitting on the wallets attached to centralized exchanges.
When the value of the metric goes up, it means the investors are making net deposits of the asset to these platforms. Generally, one of the main reasons why holders would transfer their coins into the custody of exchanges is for selling-related purposes, so this kind of trend can have bearish consequences for the BTC price.
On the other hand, the indicator witnessing a decline suggests investors are taking out a net number of tokens from the exchanges. Such a trend can be a sign that the holders want to hold their BTC into the long term, which can naturally be bullish for the asset’s value.
Now, here is a chart that shows the trend in the Bitcoin Exchange Reserve over the history of the cryptocurrency:
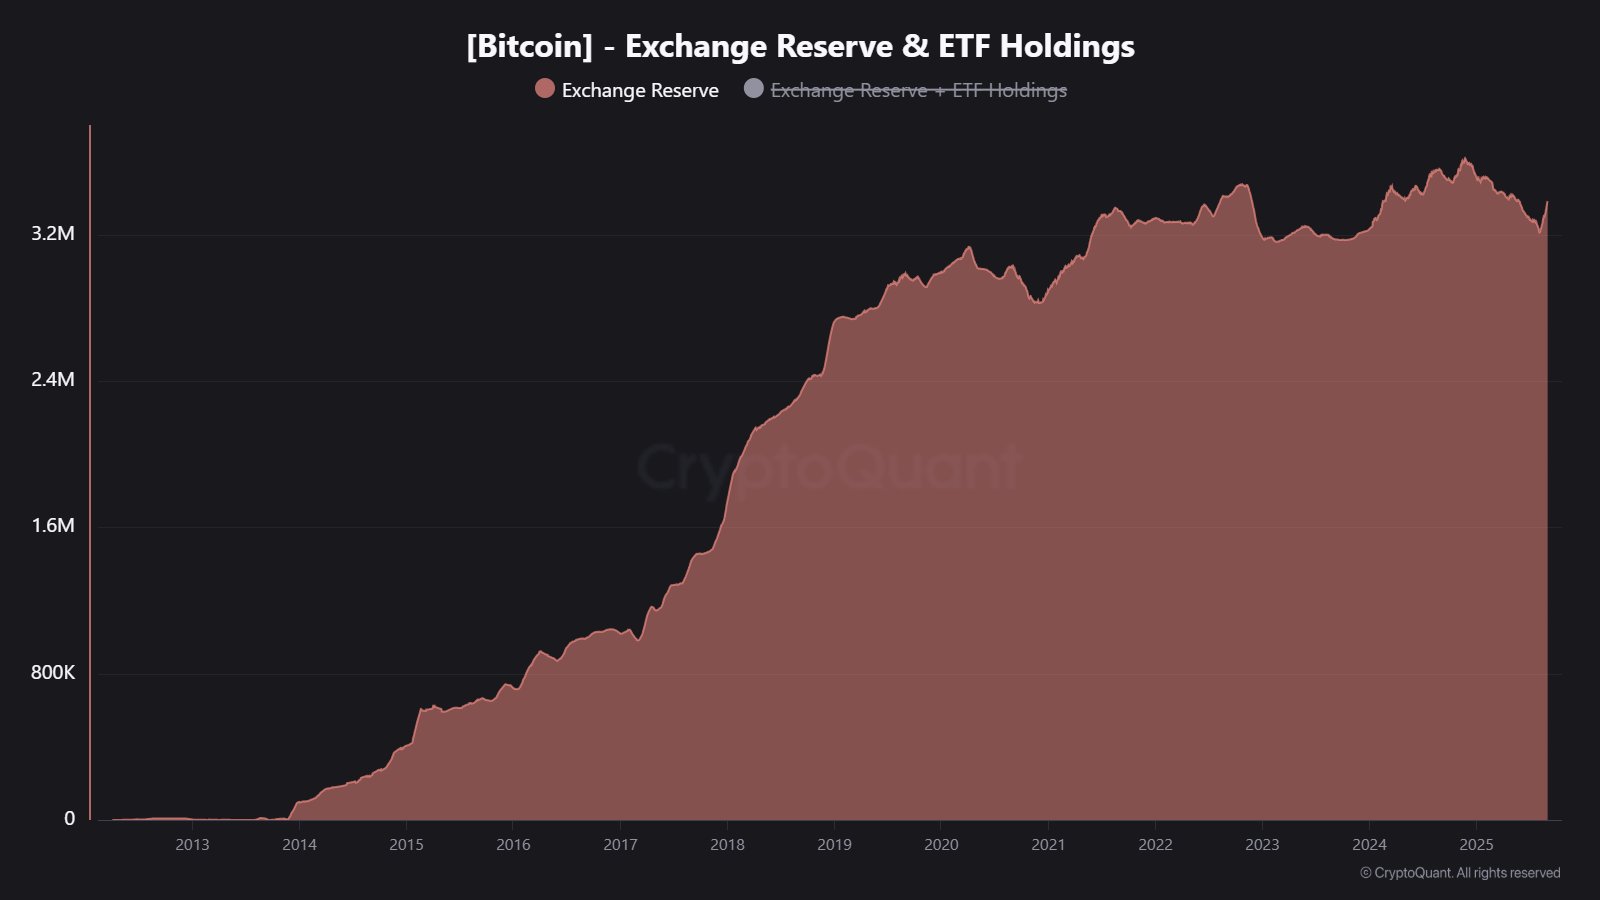
As is visible in the above graph, the Bitcoin Exchange Reserve peaked in late 2024 and saw a reversal to a downtrend, indicating that investors switched to net withdrawals.
The decline in the metric was persistent, but very recently, another turnaround has finally occurred, with the indicator shooting up instead. Its value has now reached the 3.383 million BTC mark, which is the highest that it has been in a few months.
“This signals a shift in trader behavior,” notes Maartunn. “More coins moving to exchanges often precedes increased selling pressure.” The deposit spree from the investors has come alongside a period of bearish action in the Bitcoin price. It now remains to be seen whether these exchange inflows would extend the drawdown.
Speaking of the price decline, on-chain analytics firm Glassnode has discussed about how this plunge compares against past ones in terms of the BTC supply in loss.

As displayed in the chart, only 9% of the Bitcoin supply is in loss following the price drawdown. The maximum loss among these underwater coins is also currently just 10%. As Glassnode explains,
In contrast, the local bottom of this cycle saw >25% of supply at up to 23% losses, and global bear markets have reached >50% supply with up to 78% losses. This dip remains relatively shallow.
BTC Price
At the time of writing, Bitcoin is trading around $111,200, up 2% over the last 24 hours.


+ There are no comments
Add yours