


A drop to $54,000 could mark one of the strongest buying opportunities in Bitcoin’s current cycle, according to on-chain data analysts — but the price still sits roughly 20% above that level, and some market watchers say the bottom may not yet be in.
Realized Price Draws Attention From Long-Term Investors
The metric at the center of the conversation is Bitcoin’s Realized Price, currently near $54,000. Unlike the daily spot price, this figure reflects the average cost at which every coin on the network last changed hands.
When Bitcoin trades below that level, data shows the market has often been in the grip of fear-driven selling — and historically, those moments have attracted long-term buyers looking to accumulate at a discount.
CryptoQuant analyst Tugce highlighted the metric in a recent breakdown, pointing to past cycles where Bitcoin crossed below its Realized Price and later staged significant recoveries.
Bitcoin’s Best Buy Zone? History Says This Is It!
“Below 54,000 dollars, Bitcoin is cheap compared to the market average, and it is a perfect place to make gradual accumulation and collect Bitcoin.” – By @cryptometugce pic.twitter.com/S9j9Eh7LqX
— CryptoQuant.com (@cryptoquant_com) March 31, 2026
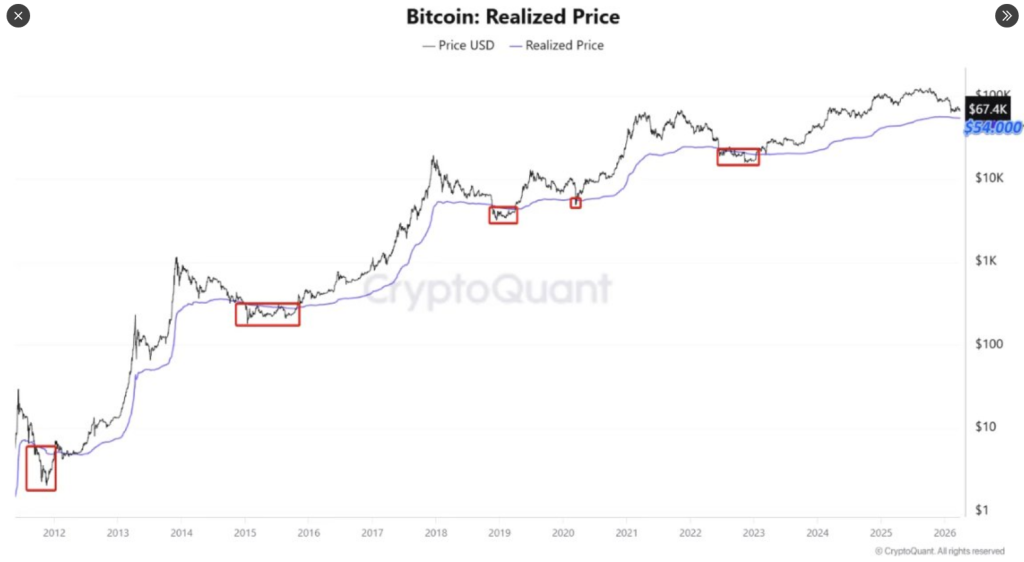
She cautioned, though, that investors should not expect a quick turnaround. Recovery timelines have ranged from as few as seven days to more than 300 days in past cycles, and prices can continue falling even after crossing below that threshold.
Bitcoin is currently trading at around $67,250 and has lost around 20% so far this year. This decline has been going on for the last five months, starting in October 2025. So far, the total decline from the peak is around 40%.
Whale Activity And Institutional Demand Raise Caution Flags
Not everyone is looking at the Realized Price with the same level of optimism. According to CryptoQuant’s statistics, whales are moving a lot of Bitcoin into the popular exchange platform Binance. This could possibly be a precursor to a sell-off.
The Whale Ratio on the Binance exchange rose from 0.39 on March 25 to 0.66 on March 29 before paring some of the gains. On March 29 alone, the exchange received a net of 2,003 Bitcoins valued at around $134 million.
Additionally, the Coinbase Premium Index has once again gone into the red, which could indicate a decrease in institutional interest in the asset class.
Global pressures on the markets are also a factor in the current decline of the asset class. Geopolitical tensions and oil prices are at a high, and the bond market is struggling. This has caused a lot of pressure on the asset class in the last few months.
Earlier in March, the asset class fell to a low of $65,000 due to the high level of volatility in the markets.
On average, around now is when #Bitcoin continues its decline in midterm years. pic.twitter.com/JZ7Rcx2wJY
— Benjamin Cowen (@intocryptoverse) March 27, 2026
Pattern From Past Cycles Points To Possible Continued Weakness
According to crypto analyst Benjamin Cowen, the current scenario in the markets is similar to the midterm cycles of 2014, 2018, and 2022. This is the period when the asset class loses steam between the second and third quarters of the year after a strong bull run in the first half of the year.
Therefore, according to this pattern, the current weakness could continue into the future. According to the technical analysis of the asset class’s chart, a bear flag formation could cause the asset class to fall between the range of $50,000 and $41,000.
Featured image from Meta, chart from TradingView


+ There are no comments
Add yours