


Dogecoin corrected some gains and traded below $0.0950 against the US Dollar. DOGE is now holding the $0.0885 support but might decline further.
- DOGE price started a fresh downside correction from $0.1020.
- The price is trading below the $0.10 level and the 100-hourly simple moving average.
- There is a key declining channel forming with resistance at $0.0935 on the hourly chart of the DOGE/USD pair (data source from Kraken).
- The price could aim for a fresh increase if it remains stable above $0.0880.
Dogecoin Price Dips Again
Dogecoin price started a downside correction after it failed to clear $0.1020, like Bitcoin and Ethereum. DOGE declined below the $0.10 and $0.0980 levels.
There was a move below the 50% Fib retracement level of the upward move from the $0.080 swing low to the $0.1020 high. The bears even pushed the price below $0.090. Besides, there is a key declining channel forming with resistance at $0.0935 on the hourly chart of the DOGE/USD pair.
Dogecoin price is now trading below the $0.10 level and the 100-hourly simple moving average. Immediate resistance on the upside is near the $0.0935 level. The first major resistance for the bulls could be near the $0.0950 level.
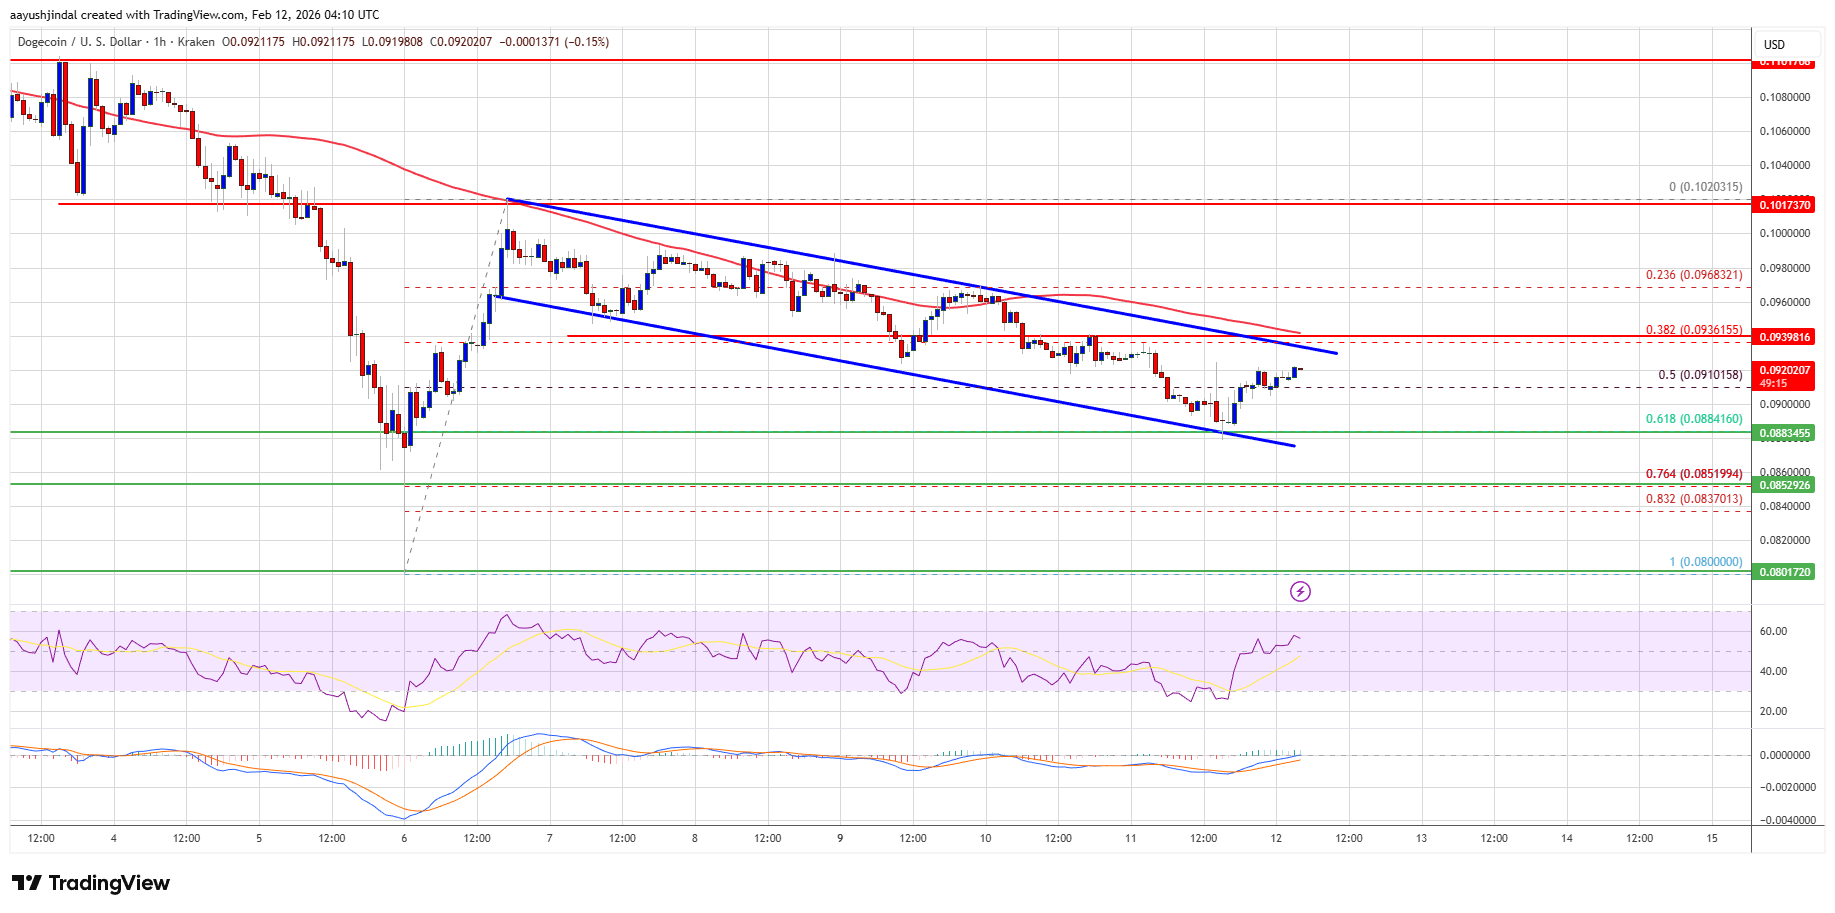
The next major resistance is near the $0.10 level. A close above the $0.10 resistance might send the price toward $0.1050. Any more gains might send the price toward $0.1120. The next major stop for the bulls might be $0.120.
More Losses In DOGE?
If DOGE’s price fails to climb above the $0.10 level, it could continue to move down. Initial support on the downside is near the $0.0885 level and the 61.8% Fib retracement level of the upward move from the $0.080 swing low to the $0.1020 high.
The next major support is near the $0.0850 level. The main support sits at $0.080. If there is a downside break below the $0.080 support, the price could decline further. In the stated case, the price might slide toward the $0.0765 level or even $0.0750 in the near term.
Technical Indicators
Hourly MACD – The MACD for DOGE/USD is now gaining momentum in the bearish zone.
Hourly RSI (Relative Strength Index) – The RSI for DOGE/USD is now below the 50 level.
Major Support Levels – $0.0885 and $0.0850.
Major Resistance Levels – $0.0935 and $0.1000.


+ There are no comments
Add yours