


Ethereum price started a major decline after it failed to clear $3,050. ETH is down 10% and is now struggling to stay above the $2,700 support.
- Ethereum failed to stay above $2,880 and started a fresh decline.
- The price is trading below $2,800 and the 100-hourly Simple Moving Average.
- There is a steep bearish trend line forming with resistance at $2,820 on the hourly chart of ETH/USD (data feed via Kraken).
- The pair could start a fresh increase if it stays above the $2,700 zone.
Ethereum Price Dips 10%
Ethereum price failed to remain stable above $2,880 and started a major decline, like Bitcoin. ETH price traded below $2,820 to enter a bearish zone.
The bears even pushed the price below $2,750. A low was formed at $2,680 and the price is now showing bearish signs below the 23.6% Fib retracement level of the recent decline from the $3,040 swing high to the $2,680 low. There is also a steep bearish trend line forming with resistance at $2,820 on the hourly chart of ETH/USD.
Ethereum price is now trading below $2,800 and the 100-hourly Simple Moving Average. If the bulls remain in action above $2,700, the price could attempt another increase. Immediate resistance is seen near the $2,765 level. The first key resistance is near the $2,820 level and the trend line.
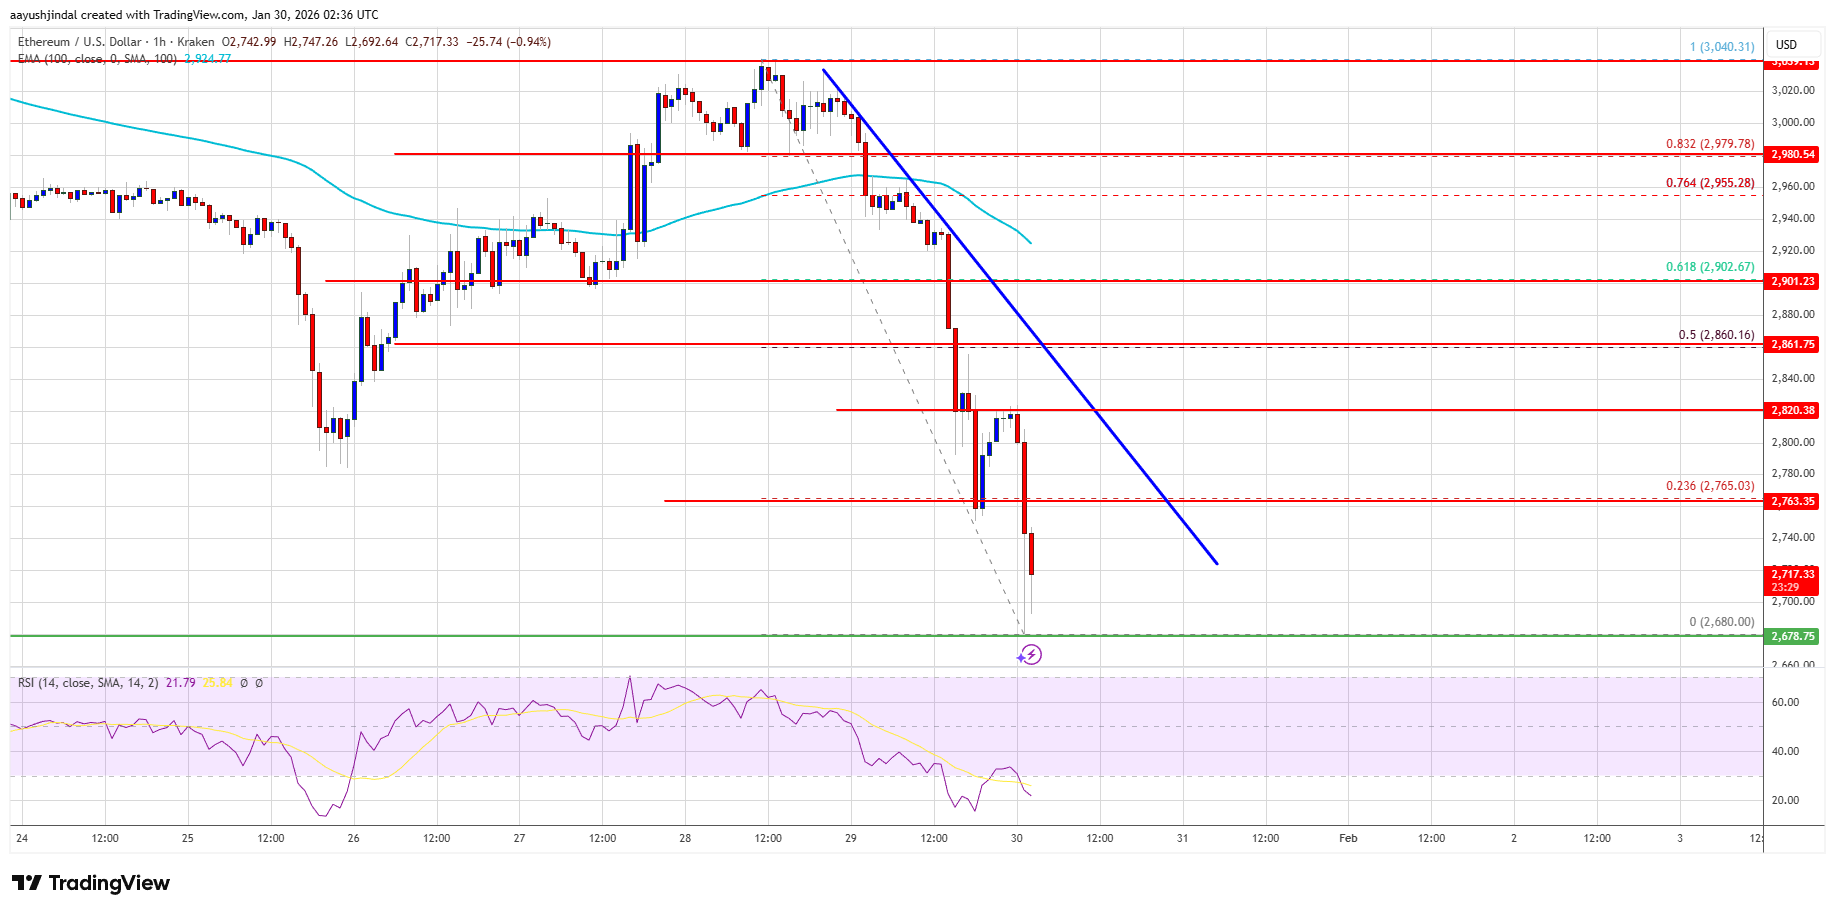
The next major resistance is near the $2,860 level and the 50% Fib retracement level of the recent decline from the $3,040 swing high to the $2,680 low. A clear move above the $2,860 resistance might send the price toward the $2,900 resistance. An upside break above the $2,900 region might call for more gains in the coming days. In the stated case, Ether could rise toward the $3,000 resistance zone or even $3,050 in the near term.
More Losses In ETH?
If Ethereum fails to clear the $2,820 resistance, it could start a fresh decline. Initial support on the downside is near the $2,700 level. The first major support sits near the $2,680 zone.
A clear move below the $2,680 support might push the price toward the $2,620 support. Any more losses might send the price toward the $2,550 region. The main support could be $2,500.
Technical Indicators
Hourly MACD – The MACD for ETH/USD is gaining momentum in the bearish zone.
Hourly RSI – The RSI for ETH/USD is now below the 50 zone.
Major Support Level – $2,700
Major Resistance Level – $2,820


+ There are no comments
Add yours