


XRP price started a recovery wave above $1.880 but failed near $1.9250. The price is now showing a few bearish signs and might decline below $1.880.
- XRP price started a recovery wave above the $1.880 zone.
- The price is now trading above $1.90 and the 100-hourly Simple Moving Average.
- There was a break above a bearish trend line with resistance at $1.880 on the hourly chart of the XRP/USD pair (data source from Kraken).
- The pair could continue to move up if it settles above $1.9250.
XRP Price Faces Key Hurdle
XRP price remained supported above $1.80 and started a recovery wave, like Bitcoin and Ethereum. The price was able to climb above $1.850 and $1.880 to enter a short-term positive zone.
There was also a move above the 50% Fib retracement level of the downward move from the $1.963 swing high to the $1.810 low. Besides, there was a break above a bearish trend line with resistance at $1.880 on the hourly chart of the XRP/USD pair.
The price even spiked above $1.920 before the bears appeared. The bulls failed to clear the $1.9250 resistance and the 76.4% Fib retracement level of the downward move from the $1.963 swing high to the $1.810 low.
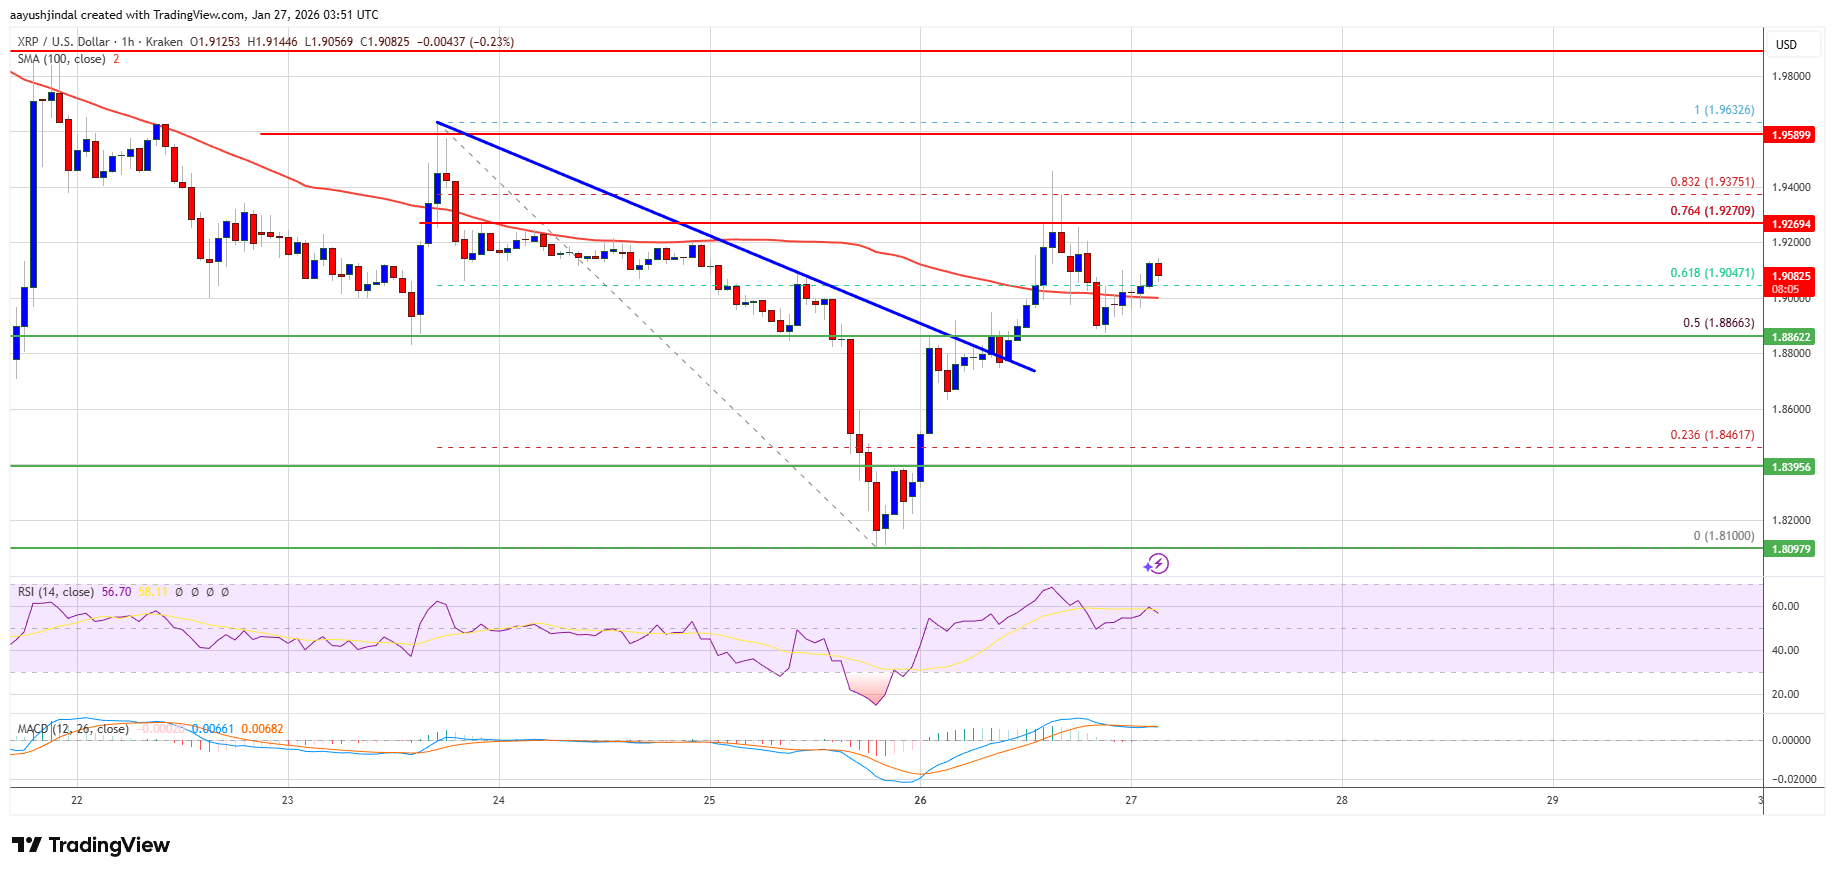
The price is now trading above $1.90 and the 100-hourly Simple Moving Average. If there is a fresh upward move, the price might face resistance near the $1.9250 level. The first major resistance is near the $1.960 level. A close above $1.960 could send the price to $2.00. The next hurdle sits at $2.050. A clear move above the $2.050 resistance might send the price toward the $2.150 resistance. Any more gains might send the price toward the $2.20 resistance.
Another Drop?
If XRP fails to clear the $1.9250 resistance zone, it could start a fresh decline. Initial support on the downside is near the $1.880 level. The next major support is near the $1.865 level.
If there is a downside break and a close below the $1.8650 level, the price might continue to decline toward $1.840. The next major support sits near the $1.820 zone, below which the price could continue lower toward $1.750.
Technical Indicators
Hourly MACD – The MACD for XRP/USD is now losing pace in the bullish zone.
Hourly RSI (Relative Strength Index) – The RSI for XRP/USD is now above the 50 level.
Major Support Levels – $1.880 and $1.8650.
Major Resistance Levels – $1.9250 and $1.960.


+ There are no comments
Add yours