


Keyrock and Dune have published a “12 Charts to Watch in 2026” dashboard that tries to pin next year’s crypto narrative to measurable market structure, where liquidity is forming, where value is being returned, and which rails are quietly becoming systemically important.
The report’s premise is straightforward: each chart pairs a live dataset with an explicit 2026 prediction. Taken together, the set reads like a checklist of whether crypto’s core primitives: trading, issuance, payments, and funding are becoming deeper and more institutional in their behavior.
12 Crypto Metrics To Watch This Year
Keyrock puts prediction markets near the top of the stack after a 2025 run that saw weekly volume rise 9.2x to just under $5 billion, with Kalshi, Polymarket and Opinion controlling a combined 98.4% share at the time of writing. For 2026, it forecasts a 5x jump versus the 2025 run-rate to $25 billion in weekly volume, and a matching 5x rise in open interest as markets deepen and positions persist longer.
On tokenization, the chart tracks non-stablecoin onchain RWA AUM, explicitly excluding stablecoins to isolate whether capital markets assets are moving onchain. Keyrock says non-stablecoin RWA AUM grew 3.4x in 2025 and projects more than 4x growth in 2026, led by tokenized cash-like products (T-bills and money market funds) and private credit, with early signs of equities and ETFs as market structure and regulation mature.
A third adoption vector is x402, which Keyrock describes as an open payments protocol pioneered by Coinbase in 2025 to let software, including AI agents pay for digital services using stablecoins. Its measurable call: weekly x402 volume exceeding $100 million in 2026, framed as a proxy for “machine-native commerce” showing up in production.
For onchain asset management, Keyrock tracks vault AUM across major providers and argues 2025 was about product maturity; 2026 is positioned as distribution. Its headline forecast is vault AUM tripling to $36 billion before year-end, alongside a prediction that at least one major broker-dealer offers an onchain vault “yield shelf.”
Derivatives are treated as the clearest stress test for depth. Keyrock highlights how the DEX-to-CEX futures trading ratio grew more than 3x in 2025, from 6.34% to 21%, and says open interest—not volume—is the key signal for whether venues can “hold risk in size” as new asset classes migrate onchain. The 2026 target: onchain perp OI exceeding $50 billion.
Value return is monitored via buybacks. The report notes multi-million-dollar programs in 2025 from Hyperliquid, Raydium and Pump.fun, and predicts weekly buyback spend reaches at least 2x 2025 levels, plus a shift away from “fixed percentage of fees” models toward “value-aware” execution (pacing bands, triggers, disciplined accumulation).
Solana MEV is framed as a distribution problem as much as a trading one. Keyrock notes tip-based MEV (validator + Jito tips) fell from a peak of 100,000 SOL (about $25 million at the time) to a low of 1,000 SOL (about $139,000), then points to the Block Assembly Marketplace (BAM) as the mechanism that could reshape where MEV is captured, away from reflexive tip spikes and toward explicit execution pricing set by apps and venues.
Moreover, Keyrock uses “shielded ZEC” as a privacy proxy and forecasts shielded deposits rising from 4.9 million to more than 7 million by end-2026. On Ethereum, it tracks whether blobs develop a meaningful fee floor and predicts a median hourly blob cost of at least $0.05 per blob on a full-year basis.
Payments show up in consumer form via crypto card spend, with the report forecasting a $500 million monthly spend print at least once in 2026. TradFi integration is tracked via spot BTC ETF AUM, with Keyrock projecting holdings surpass 2.5 million BTC in 2026 and net inflows positive in at least eight months.
Finally, the stablecoin funding chart anchors on Aave’s USDC variable borrow APY on Ethereum, which it says ranged from 2.4% to 9.8% in 2025. The forward-looking claim is about rate stability rather than level: a drop in 30-day rolling volatility of USDC borrow APY to an average below 0.25 versus roughly 0.40 in 2025—positioned as a prerequisite for longer-duration, institution-style strategies.
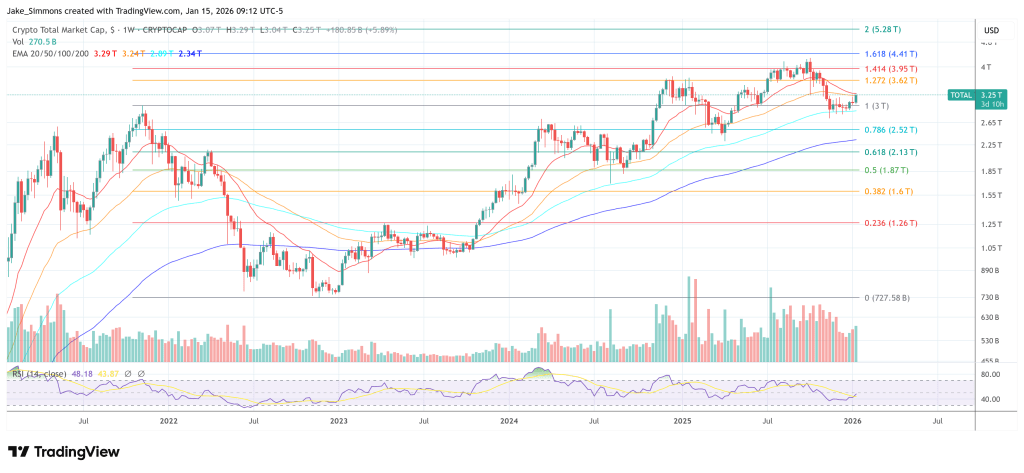
At press time, the total crypto market cap stood at $3.25 trillion.


+ There are no comments
Add yours