


XRP price started a steady increase above $2.20. The price is now consolidating gains and might aim for another increase if it clears $2.280.
- XRP price started a fresh increase above the $2.220 zone.
- The price is now trading above $2.20 and the 100-hourly Simple Moving Average.
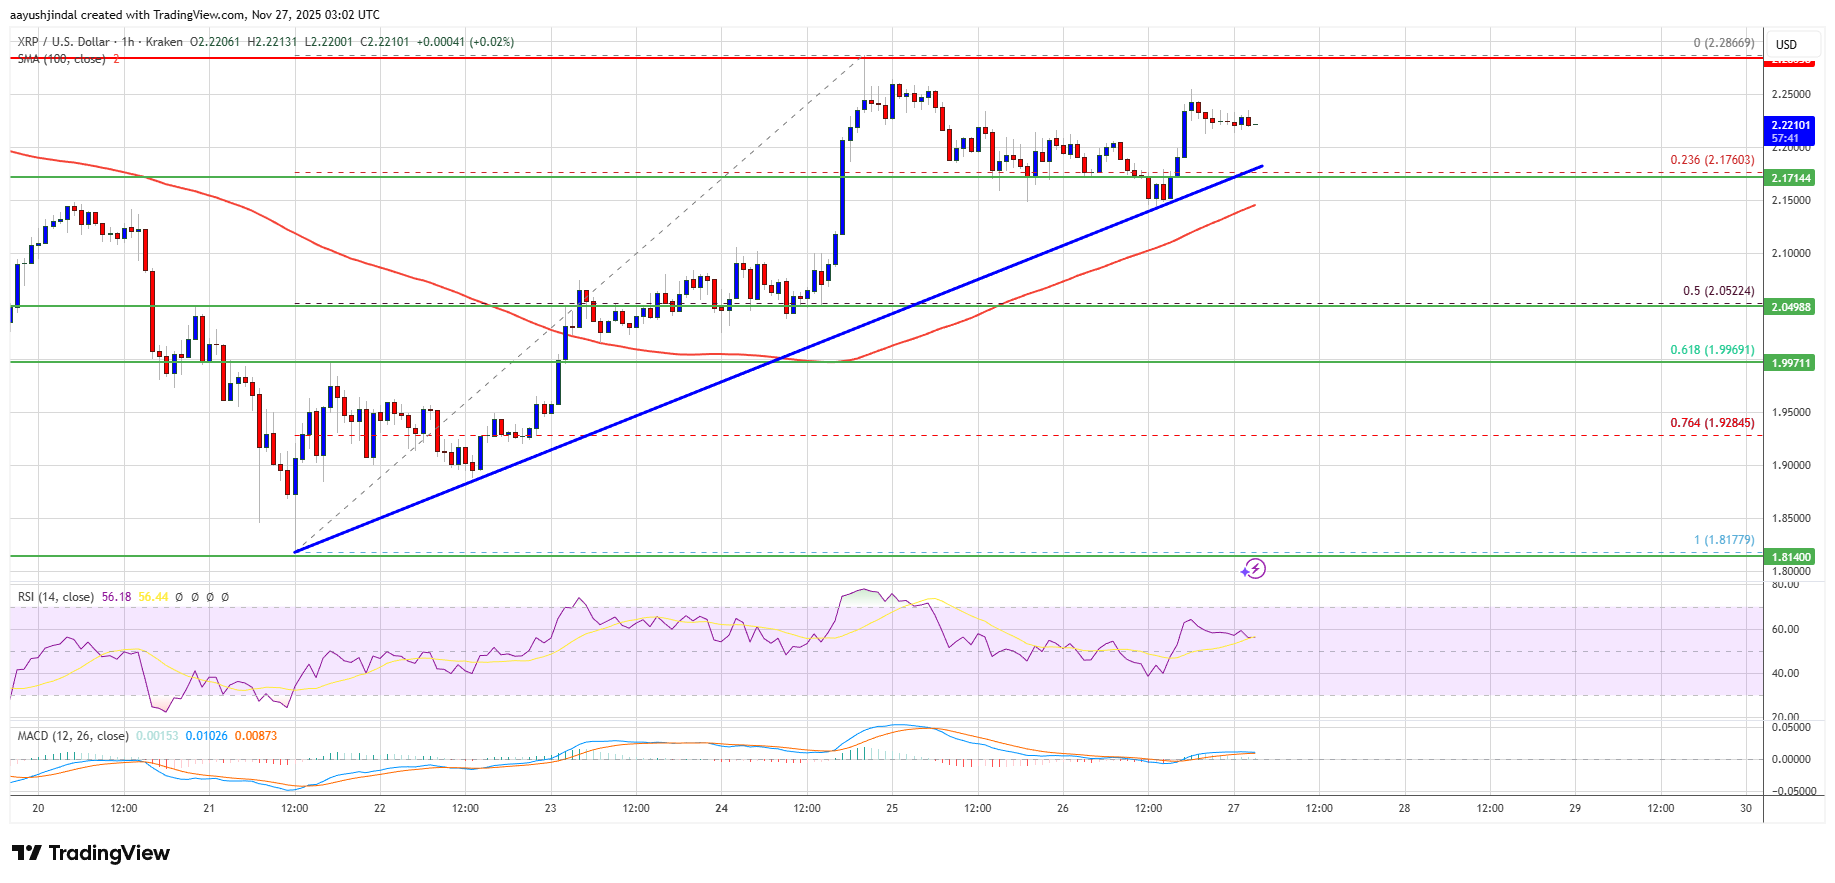
- There is a bullish trend line forming with support at $2.180 on the hourly chart of the XRP/USD pair (data source from Kraken).
- The pair could continue to move up if it clears $2.280.
XRP Price Holds Ground
XRP price started a decent upward move above $2.10 and $2.120, beating Bitcoin and Ethereum. The price gained pace for a clear move above the $2.20 resistance.
The bulls even pumped the price above the $2.220 zone. A high was formed at $2.286 and the price started a short-term downside correction, but ETH and BTC rallied. There was a move below the 23.6% Fib retracement level of the upward move from the $1.817 swing low to the $2.286 high.
The price is now trading above $2.20 and the 100-hourly Simple Moving Average. Besides, there is a bullish trend line forming with support at $2.180 on the hourly chart of the XRP/USD pair.
If there is a fresh upward move, the price might face resistance near the $2.2650 level. The first major resistance is near the $2.280 level, above which the price could rise and test $2.350. A clear move above the $2.350 resistance might send the price toward the $2.450 resistance. Any more gains might send the price toward the $2.50 resistance. The next major hurdle for the bulls might be near $2.550.
Another Pullback?
If XRP fails to clear the $2.280 resistance zone, it could start a fresh decline. Initial support on the downside is near the $2.180 level and the trend line. The next major support is near the $2.120 level.
If there is a downside break and a close below the $2.120 level, the price might continue to decline toward $2.050 and the 50% Fib retracement level of the upward move from the $1.817 swing low to the $2.286 high. The next major support sits near the $2.00 zone, below which the price could continue lower toward $1.9250.
Technical Indicators
Hourly MACD – The MACD for XRP/USD is now losing pace in the bullish zone.
Hourly RSI (Relative Strength Index) – The RSI for XRP/USD is now above the 50 level.
Major Support Levels – $2.180 and $2.050.
Major Resistance Levels – $2.280 and $2.350.


+ There are no comments
Add yours