


Bitcoin is currently trading around the $105,000 mark after a brief uptick to $107,000 in the past 24 hours. Notably, this marks the second time Bitcoin has rejected around $107,000 in the past few days. Despite this volatility, Bitcoin managed to close last week’s candle above a key resistance level that had capped its price action for weeks. This close, recorded just above the red horizontal line at $103,000, has introduced confidence in the continuation of the uptrend, and points to the bulls still in control of Bitcoin’s price action.
Bitcoin Weekly Closes Above Range – First Bullish Step
Current Bitcoin price action shows that bullish investors and buyers are still controlling the momentum behind the largest cryptocurrency and, in essence, the rest of the crypto market. Notably, Bitcoin initially experienced a brief surge to nearly $107,000 over the weekend before retreating.
This price movement was followed by a dip to around $102,000, with the back-and-forth most likely being influenced by factors such as Moody’s downgrade of U.S. debt and investor reactions to potential interest rate cuts by the Federal Reserve.
However, in an interesting note, the BTC price managed to close above the $103,000 range during this first move to $107,000, which is very important in terms of technical analysis going forward. This sentiment is echoed by crypto analyst Rekt Capital on social media platform X, who pointed out the next step that might play out for Bitcoin.
Post-Breakout Retest Underway, Says Rekt Capital
The $104,000 price level had previously acted as a stubborn ceiling throughout much of the recent Bitcoin price consolidation between $102,000 and $104,000 since May 9. However, since breaking above this level, the ensuing price action has seen the Bitcoin price retracing towards this level after another rejection at $107,000.
According to crypto analyst Rekt Capital, the dip following the $107,000 rejection isn’t necessarily bearish. Instead, it could be part of a post-breakout retest, a pattern often seen in strong bullish structures.
If this retest successfully confirms the former resistance as new support, BTC could set the stage for a breakout into fresh all-time highs. As shown in the 1W Bitcoin price chart above, the red resistance level is very close to Bitcoin’s January 2025 all-time high around $108,780.
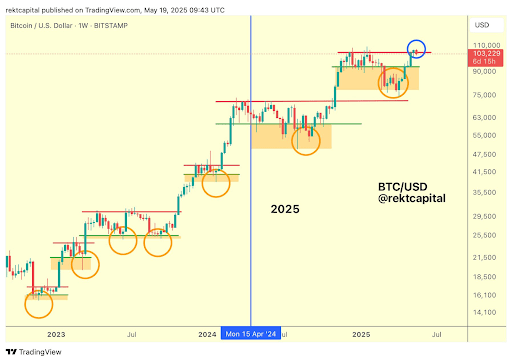
Furthermore, the chart shows that the recent breakout above the $90,000–$103,000 zone appears to mirror a pattern of Bitcoin’s breakout after a consolidation move, after another bounce from a low. In this case, the bounce occurred at the $75,000 low in early April.
If Bitcoin does rebound with enough trading volume around $104,000, this could provide the much-needed momentum for a move above $107,000 and finally above $108,700 again. At the time of writing, Bitcoin is trading at $105,555, up by 2.9% in the past 24 hours.


+ There are no comments
Add yours