


Bitcoin price started a sharp decline from well above $73,000. BTC is now consolidating and might aim for a fresh increase if it clears $72,400.
- Bitcoin started a sharp decline below $72,000 and $71,500.
- The price is trading below $72,500 and the 100 hourly simple moving average.
- There is a bearish trend line forming with resistance at $71,550 on the hourly chart of the BTC/USD pair (data feed from Kraken).
- The pair might continue to rise if it clears the $71,500 and $72,400 levels.
Bitcoin Price Starts Consolidation
Bitcoin price started a sharp decline from well above $73,000. BTC declined below $72,500 and $72,000 to enter a short-term bearish zone.
The bears even pushed the price below $71,200. There was a move toward $68,800. A low was formed at $68,782, and the pair is now consolidating losses. There was a minor upward move above $70,000. The price tested the 23.6% Fib retracement level of the recent decline from the $75,998 swing high to the $68,782 low.
Bitcoin is now trading below $72,000 and the 100 hourly simple moving average. Besides, there is a bearish trend line forming with resistance at $71,550 on the hourly chart of the BTC/USD pair.
If the price remains stable above $69,000, it could attempt a fresh increase. Immediate resistance is near the $70,800 level. The first key resistance is near the $71,500 level and the trend line. A close above the $71,500 resistance might send the price further higher.
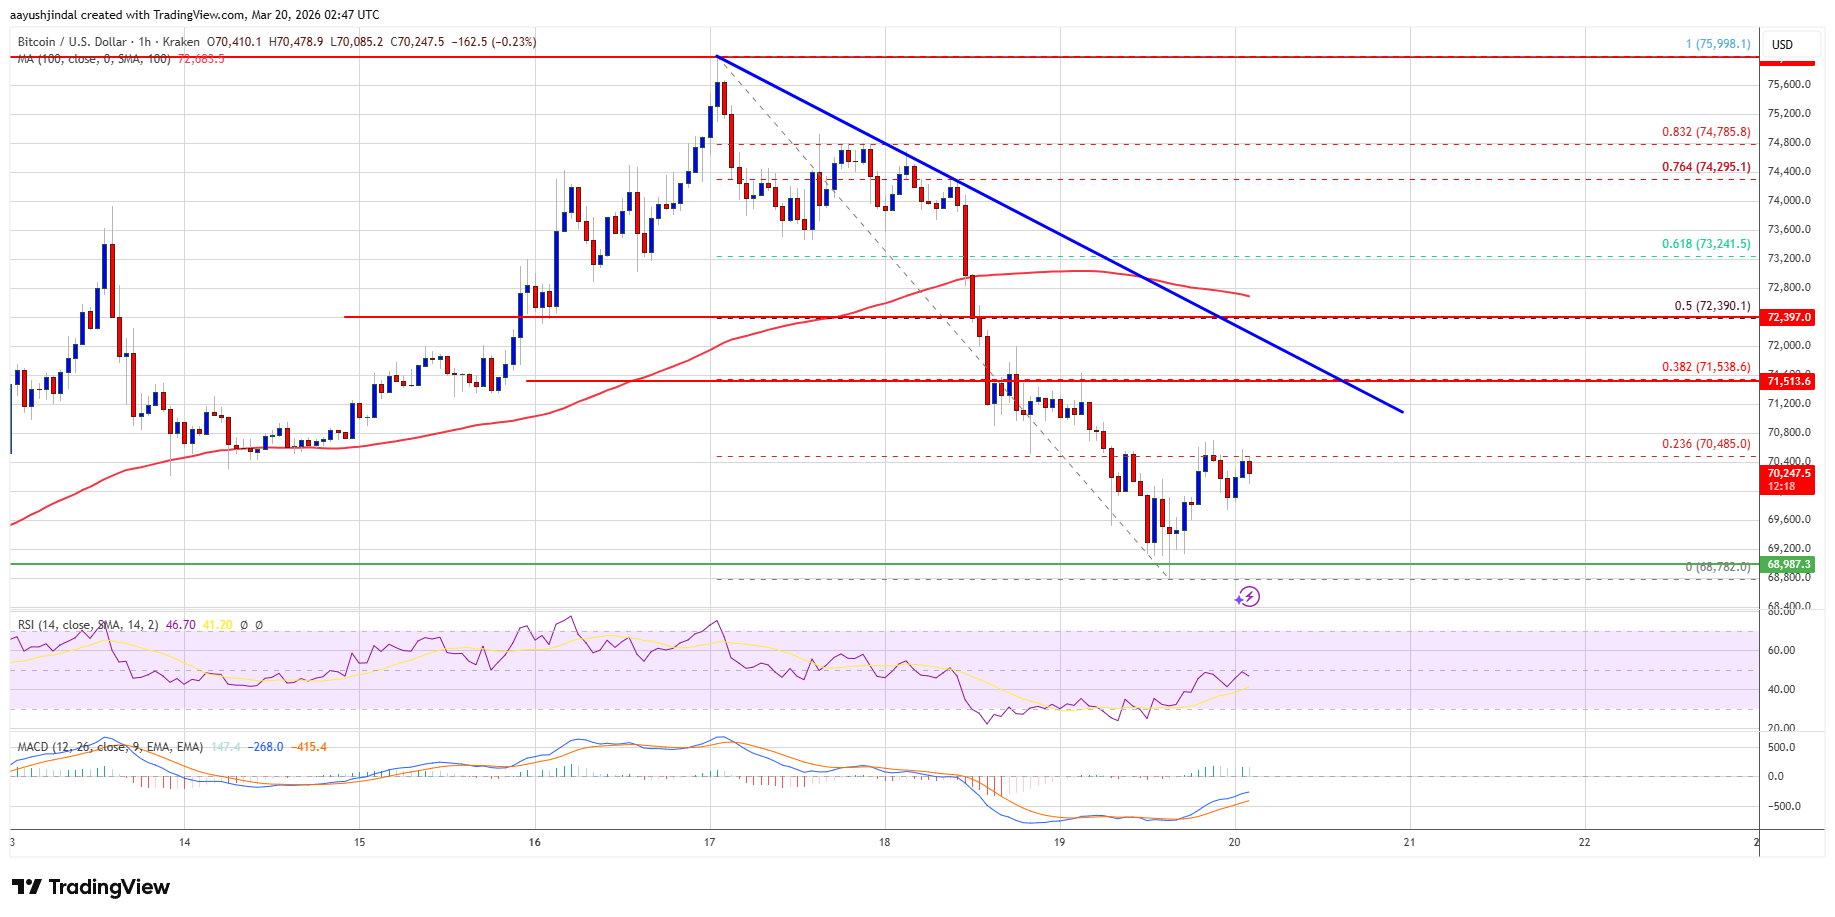
In the stated case, the price could rise and test the $72,400 resistance or the 50% Fib retracement level of the recent decline from the $75,998 swing high to the $68,782 low. Any more gains might send the price toward the $73,250 level. The next barrier for the bulls could be $74,000.
Downside Extension In BTC?
If Bitcoin fails to rise above the $72,400 resistance zone, it could start another decline. Immediate support is near the $69,650 level. The first major support is near the $69,000 level.
The next support is now near the $68,800 zone. Any more losses might send the price toward the $68,000 support in the near term. The main support now sits at $67,200, below which BTC might struggle to recover in the near term.
Technical indicators:
Hourly MACD – The MACD is now losing pace in the bearish zone.
Hourly RSI (Relative Strength Index) – The RSI for BTC/USD is now below the 50 level.
Major Support Levels – $69,650, followed by $68,800.
Major Resistance Levels – $71,500 and $72,400.


+ There are no comments
Add yours