


Bitcoin price started a downside correction below $92,500. BTC is now struggling and might face barriers for a fresh increase near $92,000.
- Bitcoin started a downside correction and traded below the $91,200 zone.
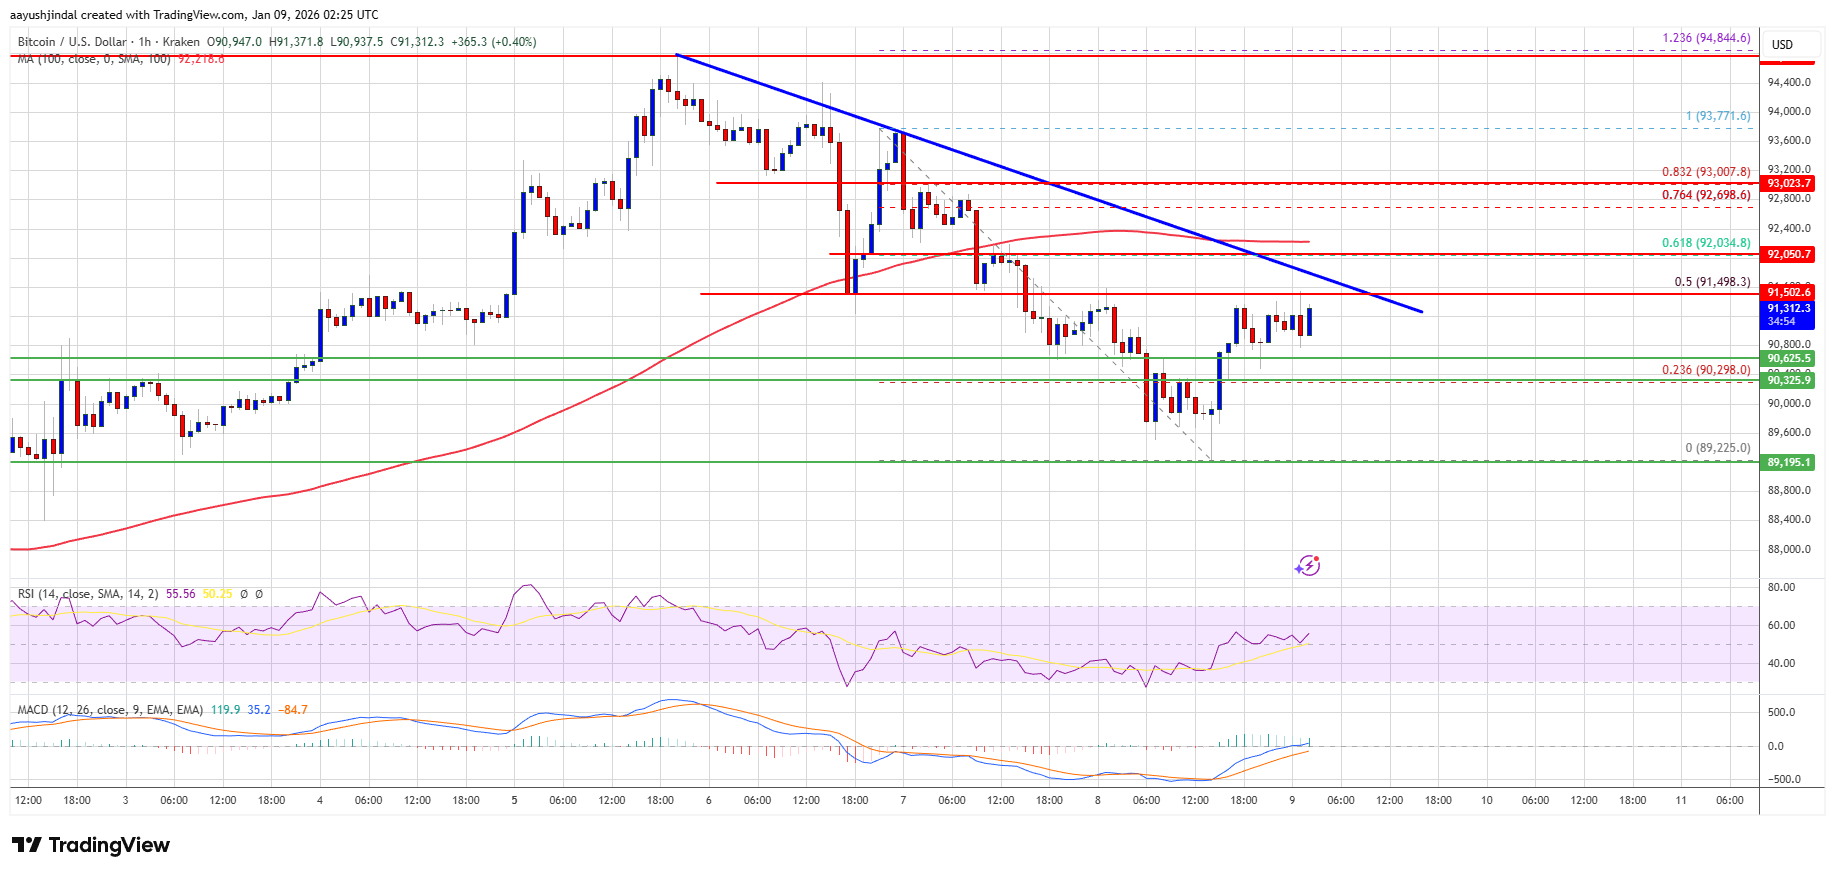
- The price is trading below $91,500 and the 100 hourly Simple moving average.
- There is a bearish trend line forming with resistance at $92,000 on the hourly chart of the BTC/USD pair (data feed from Kraken).
- The pair might continue to move down if it stays below the $92,000 zone.
Bitcoin Price Attempts Recovery
Bitcoin price failed to stay above $93,500 and started a downside correction. BTC dipped below $93,000 and $92,000 to enter a short-term bearish zone.
The price even dipped below $91,200 and tested $90,000. A low was formed at $89,225 and the price is now attempting a fresh increase. There was a move above $90,500. The price climbed higher to test the 50% Fib retracement level of the recent decline from the $93,770 swing high to the $89,225 low.
Bitcoin is now trading below $92,000 and the 100 hourly Simple moving average. Besides, there is a bearish trend line forming with resistance at $92,000 on the hourly chart of the BTC/USD pair.
If the price remains stable above $90,300, it could attempt a fresh increase. Immediate resistance is near the $91,500 level. The first key resistance is near the $92,000 level, the trend line, and the 61.8% Fib retracement level of the recent decline from the $93,771 swing high to the $89,225 low.
The next resistance could be $92,800. A close above the $92,800 resistance might send the price further higher. In the stated case, the price could rise and test the $93,200 resistance. Any more gains might send the price toward the $93,500 level. The next barrier for the bulls could be $94,000 and $94,500.
Another Decline In BTC?
If Bitcoin fails to rise above the $92,000 resistance zone, it could start another decline. Immediate support is near the $90,650 level. The first major support is near the $90,300 level.
The next support is now near the $89,250 zone. Any more losses might send the price toward the $88,500 support in the near term. The main support sits at $87,250, below which BTC might accelerate lower in the near term.
Technical indicators:
Hourly MACD – The MACD is now gaining pace in the bullish zone.
Hourly RSI (Relative Strength Index) – The RSI for BTC/USD is now above the 50 level.
Major Support Levels – $90,650, followed by $90,300.
Major Resistance Levels – $91,500 and $92,000.


+ There are no comments
Add yours