


Ethereum price started a recovery wave and surged above $3,000. ETH might continue to rise if it clears the $3,080 resistance.
- Ethereum started a recovery wave above $2,980 and $3,000.
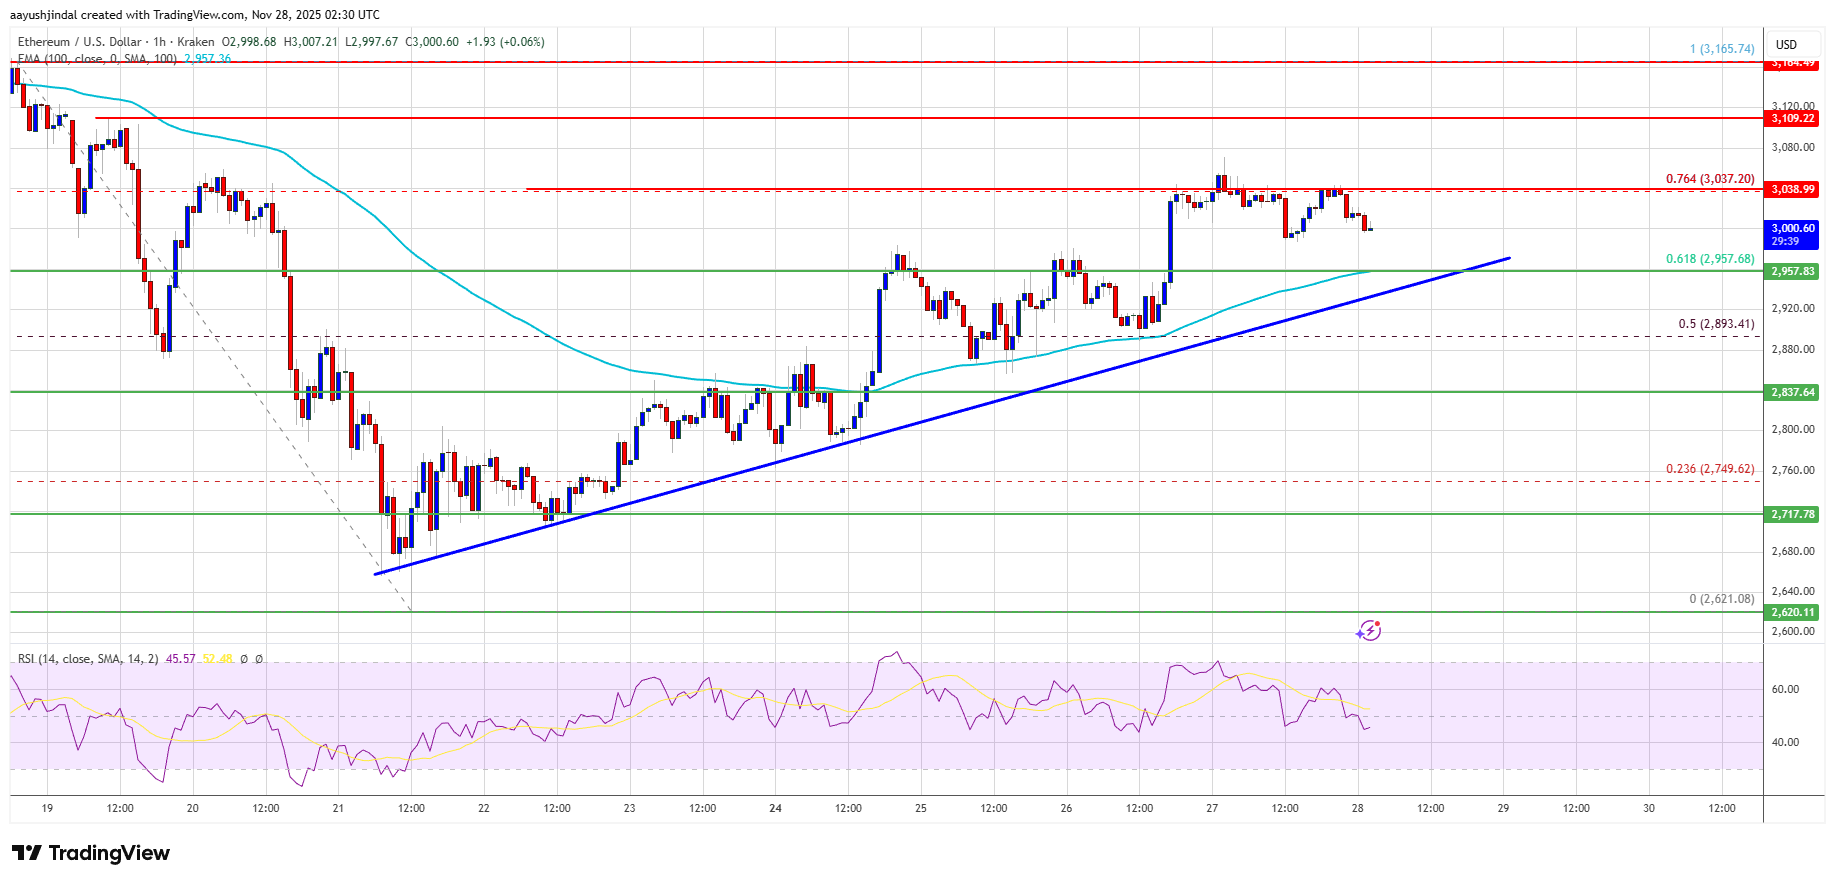
- The price is trading above $2,960 and the 100-hourly Simple Moving Average.
- There is a key bullish trend line forming with support at $2,950 on the hourly chart of ETH/USD (data feed via Kraken).
- The pair could continue to move up if it settles above the $3,080 zone.
Ethereum Price Eyes More Gains
Ethereum price managed to stay above $2,880 and started a recovery wave, like Bitcoin. ETH price was able to climb above the $2,920 and $2,950 levels.
The bulls were able to push the price above the 61.8% Fib retracement level of the downward move from the $3,165 swing high to the $2,620 low. The bulls even pumped the price above $3,000 but they struggled to clear the $3,080 zone.
The price failed to settle above the 76.4% Fib retracement level of the downward move from the $3,165 swing high to the $2,620 low. Ethereum price is now trading above $2,960 and the 100-hourly Simple Moving Average. Besides, there is a key bullish trend line forming with support at $2,950 on the hourly chart of ETH/USD.
If there is another upward move, the price could face resistance near the $3,050 level. The next key resistance is near the $3,080 level. The first major resistance is near the $3,120 level. A clear move above the $3,120 resistance might send the price toward the $3,165 resistance. An upside break above the $3,165 region might call for more gains in the coming days. In the stated case, Ether could rise toward the $3,220 resistance zone or even $3,250 in the near term.
Another Decline In ETH?
If Ethereum fails to clear the $3,080 resistance, it could start a fresh decline. Initial support on the downside is near the $2,950 level. The first major support sits near the $2,880 zone.
A clear move below the $2,880 support might push the price toward the $2,840 support. Any more losses might send the price toward the $2,800 region in the near term. The next key support sits at $2,750 and $2,740.
Technical Indicators
Hourly MACD – The MACD for ETH/USD is losing momentum in the bullish zone.
Hourly RSI – The RSI for ETH/USD is now below the 50 zone.
Major Support Level – $2,950
Major Resistance Level – $3,080


+ There are no comments
Add yours