


On-chain data shows Bitcoin investors who purchased near the price top are choosing to hold even after the latest pullback.
Bitcoin Cost Basis Distribution Shows Supply Still Firm Above $118,000
In a new post on X, the on-chain analytics firm Glassnode has discussed the latest trend in the Cost Basis Distribution Heatmap of Bitcoin. This indicator tells us about how much of the asset’s supply was purchased at the various spot price levels. In on-chain analysis, supply cost basis is considered a key concept, as investor behavior is often more pronounced when the cryptocurrency is trading at or near its acquisition level.
When the market mood is bullish, investors in profit may see price declines toward their cost basis as ‘dip‘ buying opportunities. This can make levels concentrated with supply under the spot price support boundaries. Similarly, holders in loss can look forward to retests of their acquisition mark so that they can exit the market with their money ‘back.’ This selling can provide resistance to the asset.
Now, here is the chart shared by Glassnode that shows the trend in the Bitcoin Cost Basis Distribution Heatmap over the past month:
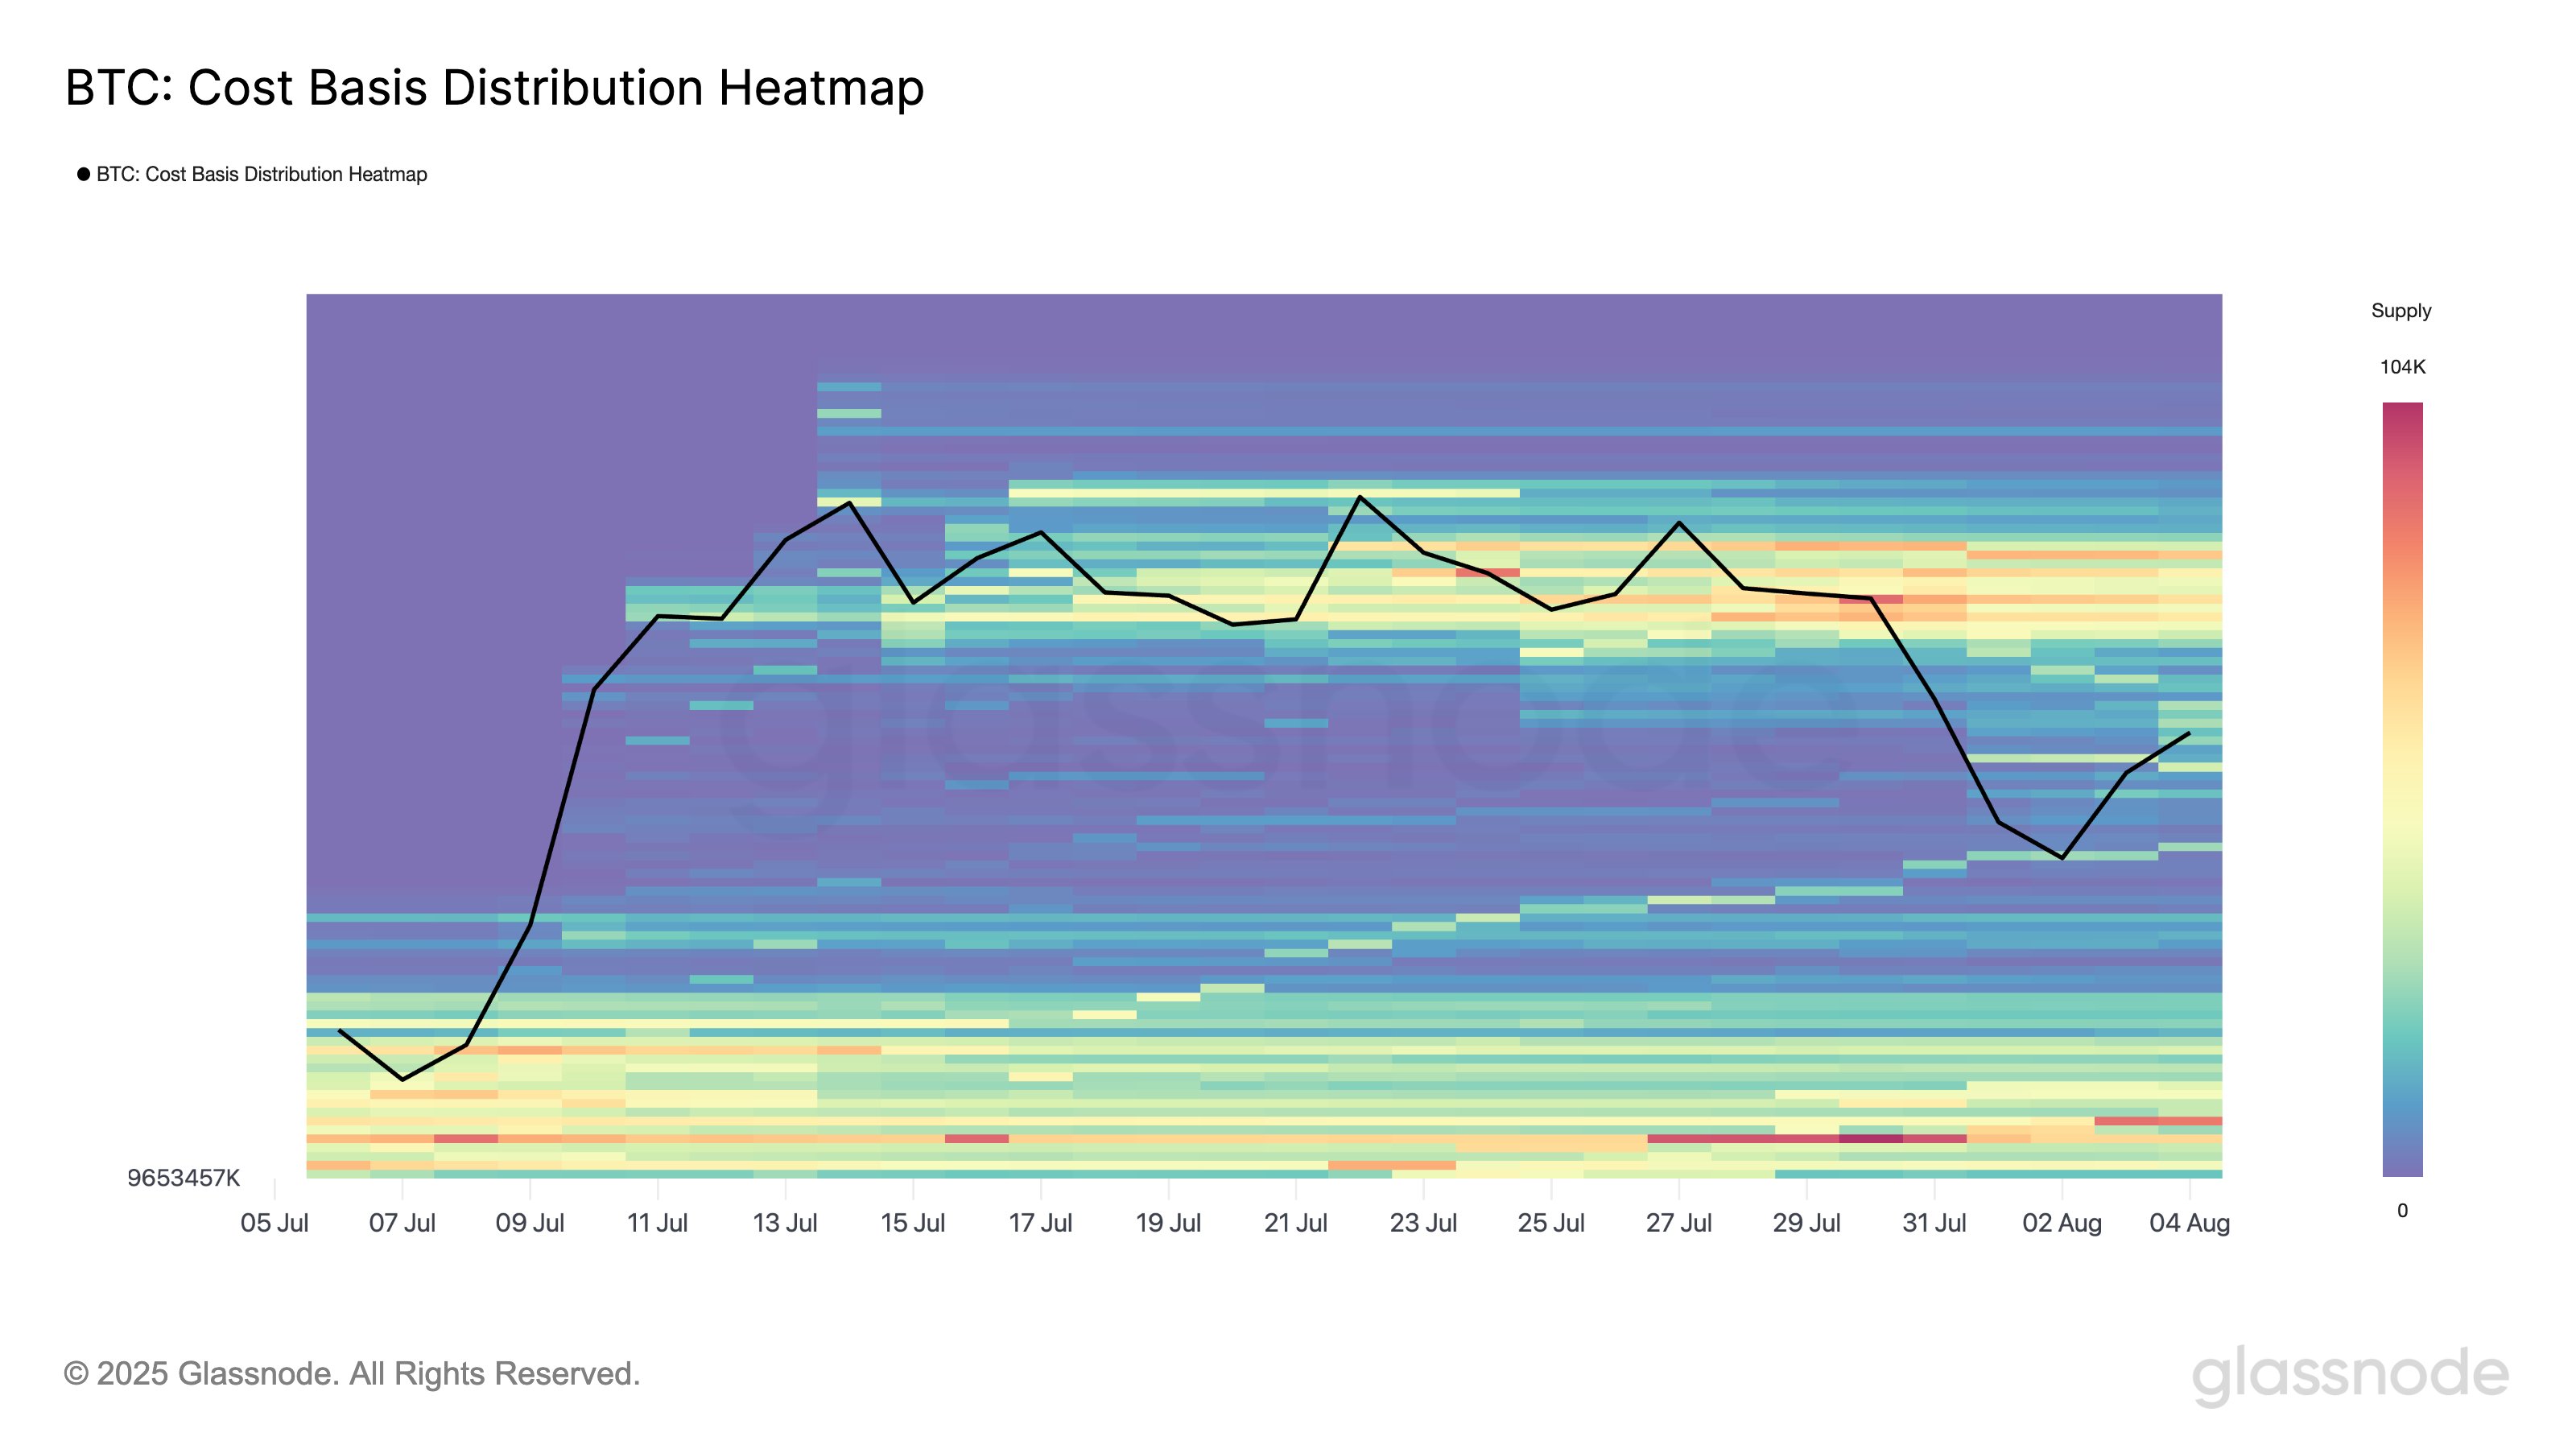
As displayed in the above graph, the Bitcoin Cost Basis Distribution Heatmap formed a sort of “airgap” as a result of the cryptocurrency’s explosive run toward the new all-time high (ATH) last month. Gaps like these form whenever BTC runs by levels too fast for supply to change hands, leaving no dense cost basis centers in that range. The airgap that gets left behind corresponds to a “free for all” space in terms of investor behavior, as there are no major support or resistance levels built into it yet.
From the chart, it’s visible that as Bitcoin consolidated earlier, supply gradually became concentrated at levels above $116,000, but below that mark, supply remained thin up to $109,000.
With the latest plunge, the asset is finally exploring this airgap, and so far, supply is being filled in. This could be an indication that the investors are interested in buying the dip, which may help form a support cluster in the range.
Another interesting trend that’s apparent in the graph is that a notable amount of supply still retains its cost basis between $118,000 and $120,000. While some panic selling has occurred from investors who purchased in this range, a lot of them appear to be choosing to hold strong instead.
It now remains to be seen how the Bitcoin airgap would develop in the coming days and whether these top buyers would continue to stand firm.
BTC Price
At the time of writing, Bitcoin is floating around $114,200, down 4% in the last seven days.


+ There are no comments
Add yours