


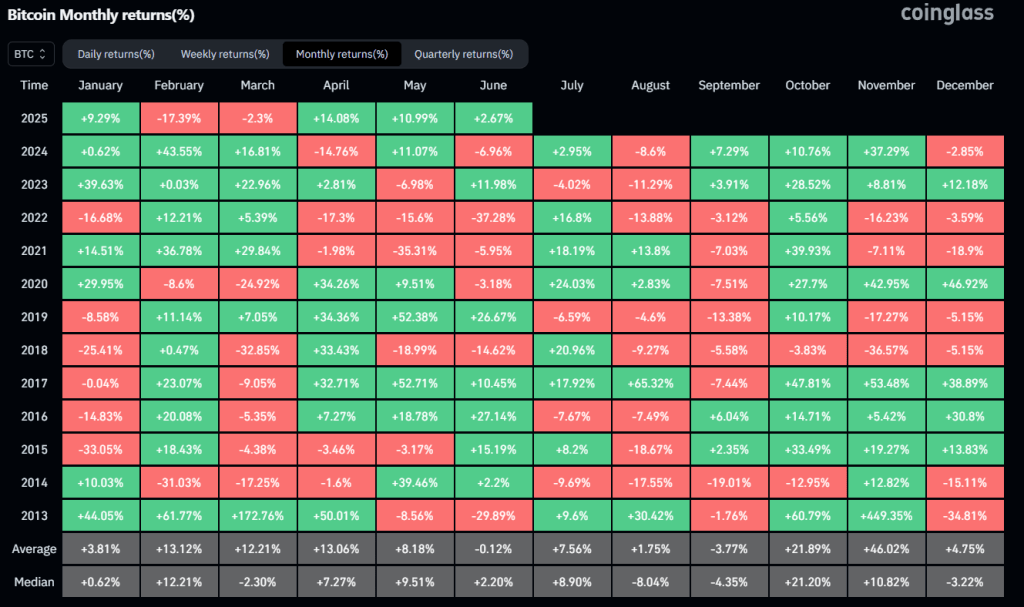
Market tactician Daan Crypto Trades (@DaanCrypto) has put a statistical spotlight on Bitcoin’s habit of dozing through June before rewarding – and sometimes punishing – traders in the following quarter. “BTC June has historically been a pretty slow month,” he wrote, noting that the just-ended period was no exception, with spot prices meandering in a narrow band and finishing “pretty flat.” The comment was accompanied by a Coinglass heat-map of monthly returns that reaches back to 2013 and vividly illustrates the summer pattern he is talking about.
What July Hides For Bitcoin
The numbers support the observation. According to the Coinglass dataset, the mean return for June over the past twelve years is essentially zero (-0.12 %), while July posts a respectable +7.56% on average and an even stronger +8.90 % on the median. August cools to a modest +1.75% mean, and September is where the sell-side pressure historically bites, averaging -3.77% with a negative median of -4.35%.
A simple frequency count underscores the asymmetry: July has finished green in eight of the last twelve years, whereas August and September managed only four positive outcomes each. Years that veterans still recall – 2017’s +65.32 % August melt-up followed by a -7.44 % September slide, or 2020’s +24.03 % July rally that surrendered to a -7.51 % September pullback – appear to have etched the “big flush-out” narrative into collective memory.
Daan’s takeaway is behavioural rather than predictive: “August & September are where we often see a big flush-out but are also the dips you often want to be buying into the end-of-the-year rally… it’s good to be aware of these seasonalities. That way you can focus more on the larger timeframe and won’t get spooked or get over-excited too easily.”
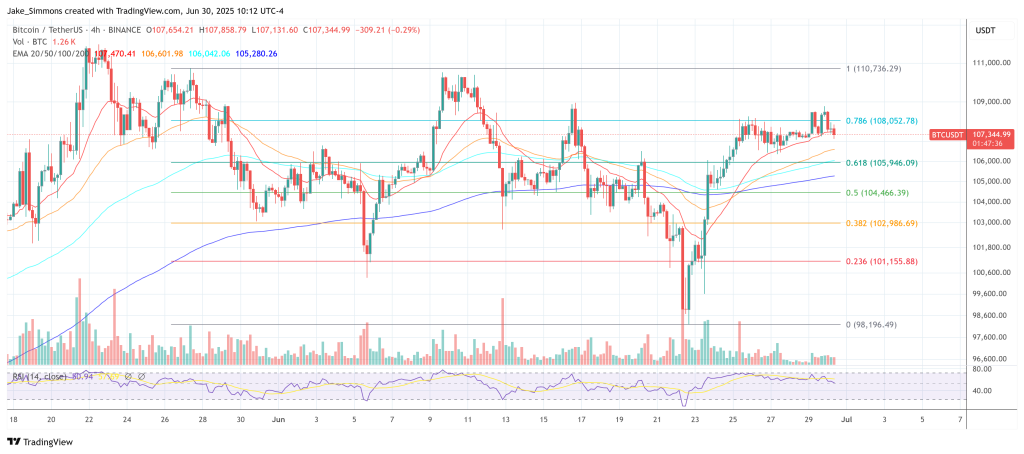
The comment arrives just as Bitcoin tests a cluster of long-timeframe resistances. In a post on Saturday he reminded followers that BTC is “close to all-time high but at resistance… [it] is yet to close a weekly or more than two consecutive daily candles above that resistance. Once it does, we can start getting excited for a larger move.”
The seasonality conversation matters because it collides with a crowded macro calendar and a notoriously illiquid holiday stretch. While historical averages do not guarantee future performance, the heat-map suggests that directional conviction often returns in October – the best-performing month on the table with a +21.89 % mean. For traders, that leaves a two-month corridor in which whipsaw moves are common and positioning discipline becomes paramount.
Daan extends the framework to altcoins via the TOTAL3 index (crypto market cap excluding Bitcoin and Ether). “The TOTAL Altcoin Market Cap has held on to its local support but is still not showing any clear trend… to really get this high timeframe move going you want to break those local highs above the ~$950 B mark. At that point you can start aiming for cycle highs.”
Whether 2025 repeats the seasonality script will hinge on the macro environment, ETF inflows and, above all, Bitcoin’s ability to convert resistance into fresh price discovery. Until that weekly close arrives, seasoned traders appear content to keep summer expectations firmly tethered to the data – exactly as Daan recommends.
At press time, BTC traded at $107,344.


+ There are no comments
Add yours