


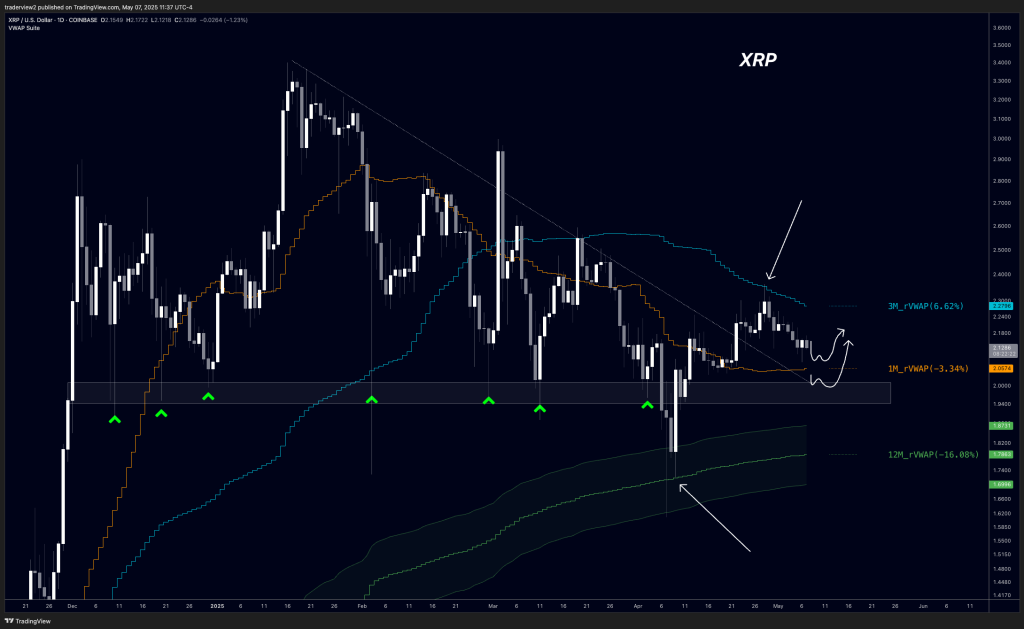
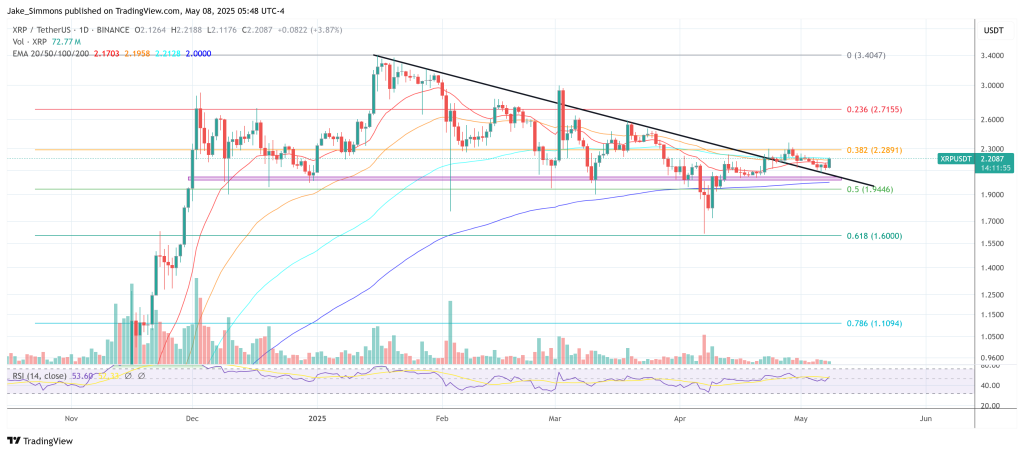
XRP is drifting back to the lower boundary of a five-month trading range, yet the higher-time-frame structure remains intact, according to a daily chart published on May 7 by analyst Dom (@traderview2). The chart covers late-December 2024 through the first week of May 2025 and shows XRP after breaking above a descending trend line that originates at the January 16 high near $3.40.
XRP Is ‘Holding Strong’
Dom’s analysis hinges on a trio of anchored Volume-Weighted Average Prices, or VWAPs, which are plotted as adaptive bands on the chart. VWAP represents the average price of an asset over a specified period, weighted by trading volume; in essence it tells traders the level at which the bulk of transactions have occurred.
Because large institutional desks often benchmark execution quality against VWAP, the line tends to act as dynamic support or resistance when price retests it. When the anchor point is shifted—from the start of the month, quarter or year, for example—each VWAP offers a lens on how supply-and-demand has evolved over that discrete window.
The cyan line marks the quarterly anchored VWAP, currently situated at $2.2796, a level that rejected price last week and precipitated the ongoing pullback. The orange line denotes the monthly VWAP, now at $2.0574, and price is hovering just above it; Dom sketches a curved route suggesting that a constructive bounce here could propel XRP back toward the mid-$2.20s.
Below, a green ribbon captures the yearly anchored VWAP at $1.8731, flanked by its standard-deviation envelopes at $1.7863 and $1.6996. The April 7 capitulation wick bottomed precisely into that yearly mean before snapping higher, underscoring its significance as a structural foothold.
“The VWAPs continue to play perfect, local low was yearly VWAP, rejection last week was off quarterly VWAP and now we are heading to retest the monthly VWAP,” Dom states.
The Key Support Zone
Horizontal action is equally telling. Since early December the market has ranged between roughly $1.94 and $2.05, a zone highlighted on the chart by a grey rectangle and six green arrows flagging prior deflections. Dom characterises the present retreat as a “healthy retest” of that floor; only a decisive daily close below the band would tilt the bias decisively bearish.
Until then, XRP is, in his words, “already strong” relative to other large-capitalisation altcoins that have broken comparable ranges, even though it is temporarily exhibiting weakness versus a surging Bitcoin dominance index. “XRP is still holding its range from Dec (no other large cap is anywhere near that) so it’s already been strong while others just bled. BTC.D is on a terror run and BTC is just dominating the flows,” Dom writes via X.
Technicians will focus on two intersecting signposts over the coming sessions: whether bulls can defend the $2.00 handle and whether the monthly VWAP can again flip from resistance to short-term support. A failure at any of those checkpoints opens the door for a deeper voyage toward the yearly VWAP around $1.87, while a successful defense would reinforce the narrative that the larger consolidation remains merely a pause within a still-valid structural up-trend.
“I am expecting a reaction off this range low, losing that would be where things turn bearish/murky, but for now, it’s a healthy chart,” Dom concludes.
At press time, XRP traded at $2.20.


+ There are no comments
Add yours