


On-chain data shows the Bitcoin network activity has recently declined into the bear market zone. Here’s what this could mean for the asset.
CryptoQuant’s Bitcoin Network Activity Index Is Flashing A Bear Market Signal
As pointed out by an analyst in a CryptoQuant Quicktake post, the Bitcoin Network Activity Index has recently been inside the bear phase. The “Network Activity Index” here refers to an indicator from CryptoQuant that essentially tracks the amount of activity that the BTC network is witnessing.
The metric uses the data of different activity-related indicators like the transaction count and daily active addresses in order to determine the situation on the blockchain.
Here is the chart shared by the quant that shows the trend in the index and its various moving averages (MAs) over the cryptocurrency’s history:

As displayed in the above graph, the Bitcoin Network Activity Index reached a peak last year, but since December, the metric has been sharply moving down, implying the demand for using the network has been waning. Generally, a surge in user activity is what provides the fuel that any move in the asset’s price needs to be sustainable, so an increase in the Network Activity Index may be considered constructive, while a decrease a bad sign.
Recently, the trend in the network activity has developed in such a manner that the index has entered into what’s considered as a “bear phase.” From the chart, it’s visible that this red signal has maintained even after the latest recovery rally.
The signal has historically come alongside bear markets for Bitcoin (arriving before the price low is in), but there was one notable exception: the second half of the bull run in 2021.
The Network Activity Index signaled a bear phase during this rally, which suggests that, from the perspective of chain usage, this run was always unlikely to last. This may be one of the reasons why the price couldn’t reach a much higher top than the May 2021 one during this bull run.
Nonetheless, Bitcoin was still able to witness a notable period of bullish momentum back then despite the Network Activity Index signal. Thus, while the latest red signal from the metric can indicate the presence of a bear market, it could also just be a signal for a buying opportunity.
In some other news, the combined market cap of the stablecoins has just reached a new all-time high (ATH), as the market intelligence platform IntoTheBlock has shared in an X post.
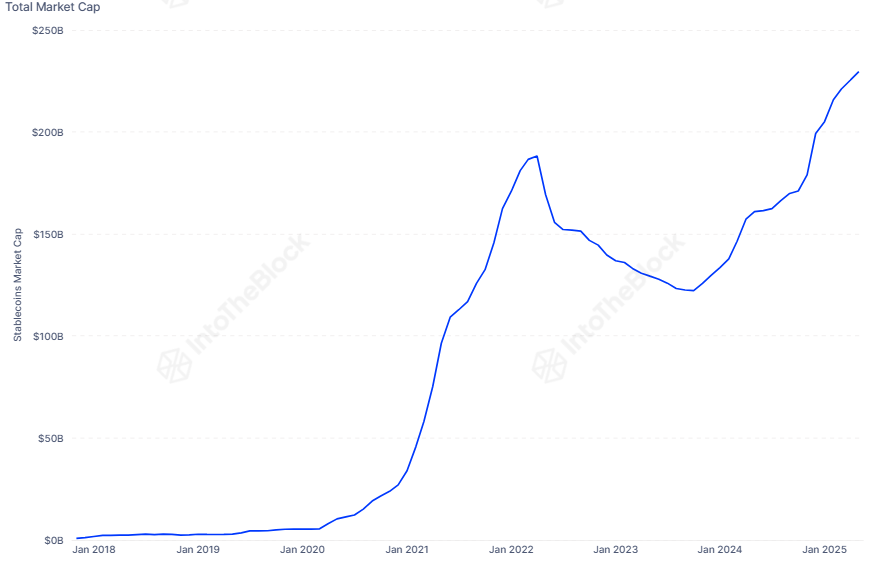
The capital stored in the form of stablecoins may find its way into other cryptocurrencies like Bitcoin, so a rise in their market cap might be looked at as a bullish sign for the sector as a whole.
BTC Price
At the time of writing, Bitcoin is trading around $93,800, down around 1% in the last week.


+ There are no comments
Add yours