


Daily price action in the SOL/BTC pair is beginning to paint a sharply different picture from the one that dominated the first quarter, according to a chart shared on Sunday by veteran trader Josh Olszewicz.
The one-day chart sets out a textbook inverse-head-and-shoulders (iHS) basing pattern that has been forming since early March and is now approaching the neckline around 0.00162 BTC. At the time of the screenshot, SOL was quoted at 0.001588 BTC. With bitcoin changing hands near $94,765, that places Solana at roughly $150 per coin.
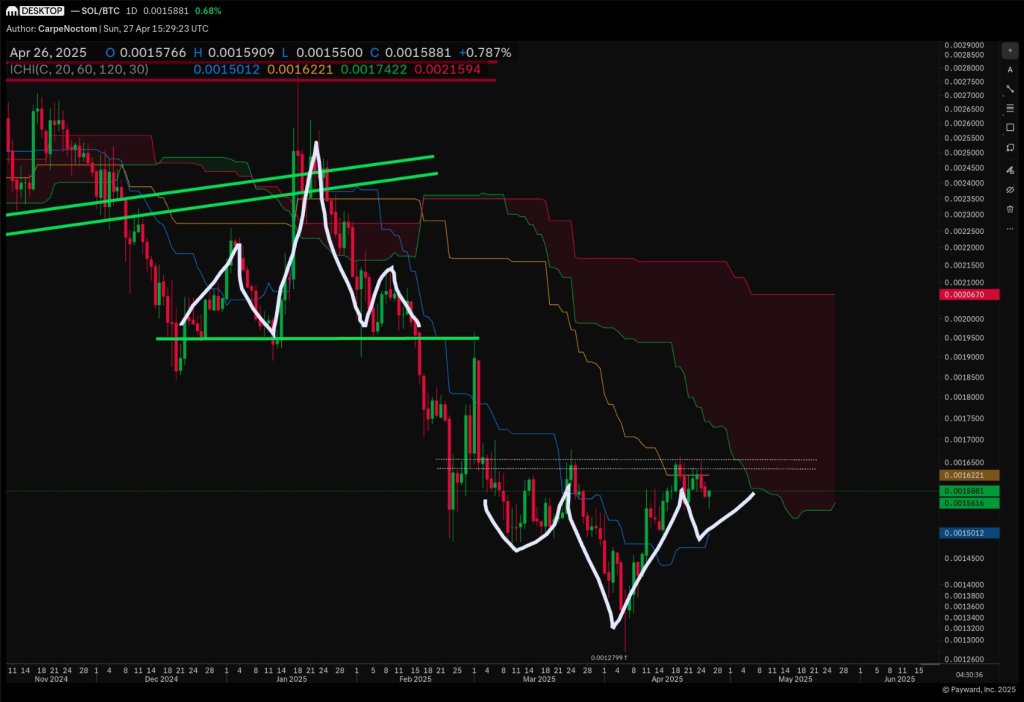
The anatomy of the pattern is hard to miss: a March 19 low at 0.00127 BTC ($120) forms the head, flanked by higher swing lows on March 11 left shoulder). The left shoulders is currently in the process of forming. The horizontal neckline aligns with the late-December floor that broke down in February, converting sturdy support into equally sturdy resistance. Measured from the head to the neckline, the amplitude is roughly 0.00033 BTC; a clean breakout would imply a technical objective near 0.00195 BTC—conveniently the lower boundary of the Kumo cloud’s far edge.
Solana Bulls Have A Target
The chart is overlaid with a long-look Ichimoku configuration (20/60/120/30). At the latest close the Tenkan-sen sat at 0.00150 BTC, the Kijun-sen exactly on the neckline at 0.00162 BTC, and Senkou Span A printed 0.001742 BTC while Span B held higher at 0.002159 BTC. The cloud itself remains bearish—thick, red and overhead—yet the span differential is beginning to compress, signalling waning downward momentum. A decisive push into the Kumo would trigger the classic Ichimoku edge-to-edge trade, targeting Span B at roughly 0.00216 BTC (about $205).
The bullish setup is occurring only two months after the market completed the mirror image of the same pattern. From mid-December to early-February, SOL/BTC carved out a prominent head-and-shoulders, lost the neckline in early February and cascaded directly to March’s iHs. That down-and-up symmetry gives extra weight to the current formation by demonstrating how faithfully the pair has respected classical geometry during the past half-year.
“1D SOL/BTC – iHS + E2E at some point but not soon, probably late May,” Olszewicz wrote on X. The analyst’s caution reflects the fact that price is still beneath both the neckline and the Kijun-sen, and the Kumo does not thin materially until the final week of May. A premature break attempt risks rejection into a final right-shoulder retest near 0.00151 BTC ($143), which is also where the Tenkan-sen currently resides.
Notably, the Chikou Span (lagging line) remains below price and cloud, emphasising that trend confirmation is pending; both Ichimoku purists and pattern traders could therefore agree that 0.00162 BTC is the line Solana bulls must flip decisively.
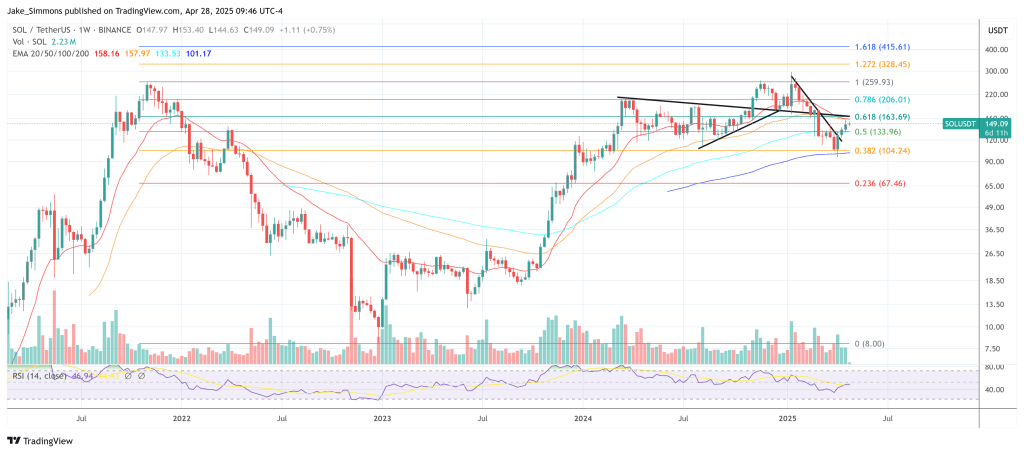
If the edge-to-edge objective is achieved, SOL would add roughly 26 % against Bitcoin from present levels and reclaim ground last seen in early February. Should the neckline reject yet again, downside protection is thin until the twin shoulders at 0.00145–0.00148 BTC; a break of that shelf would invalidate the bullish thesis and reopen the March trough.
For now, the market is content to coil beneath resistance while the clock ticks toward the cloud’s inflection. Whether Olszewicz’s late-May timetable proves prescient will depend on Bitcoin’s own trajectory and the broader risk environment, but the price structure on the Solana/Bitcoin chart is clear: after a bruising winter, the bulls finally have a pattern worth defending.
At press time, SOL traded at $149.


+ There are no comments
Add yours