


Dogecoin started a recovery wave above the $0.140 zone against the US Dollar. DOGE is now facing hurdles near $0.1450 and might struggle to continue higher.
- DOGE price started a decent upward move above $0.140 and $0.1410.
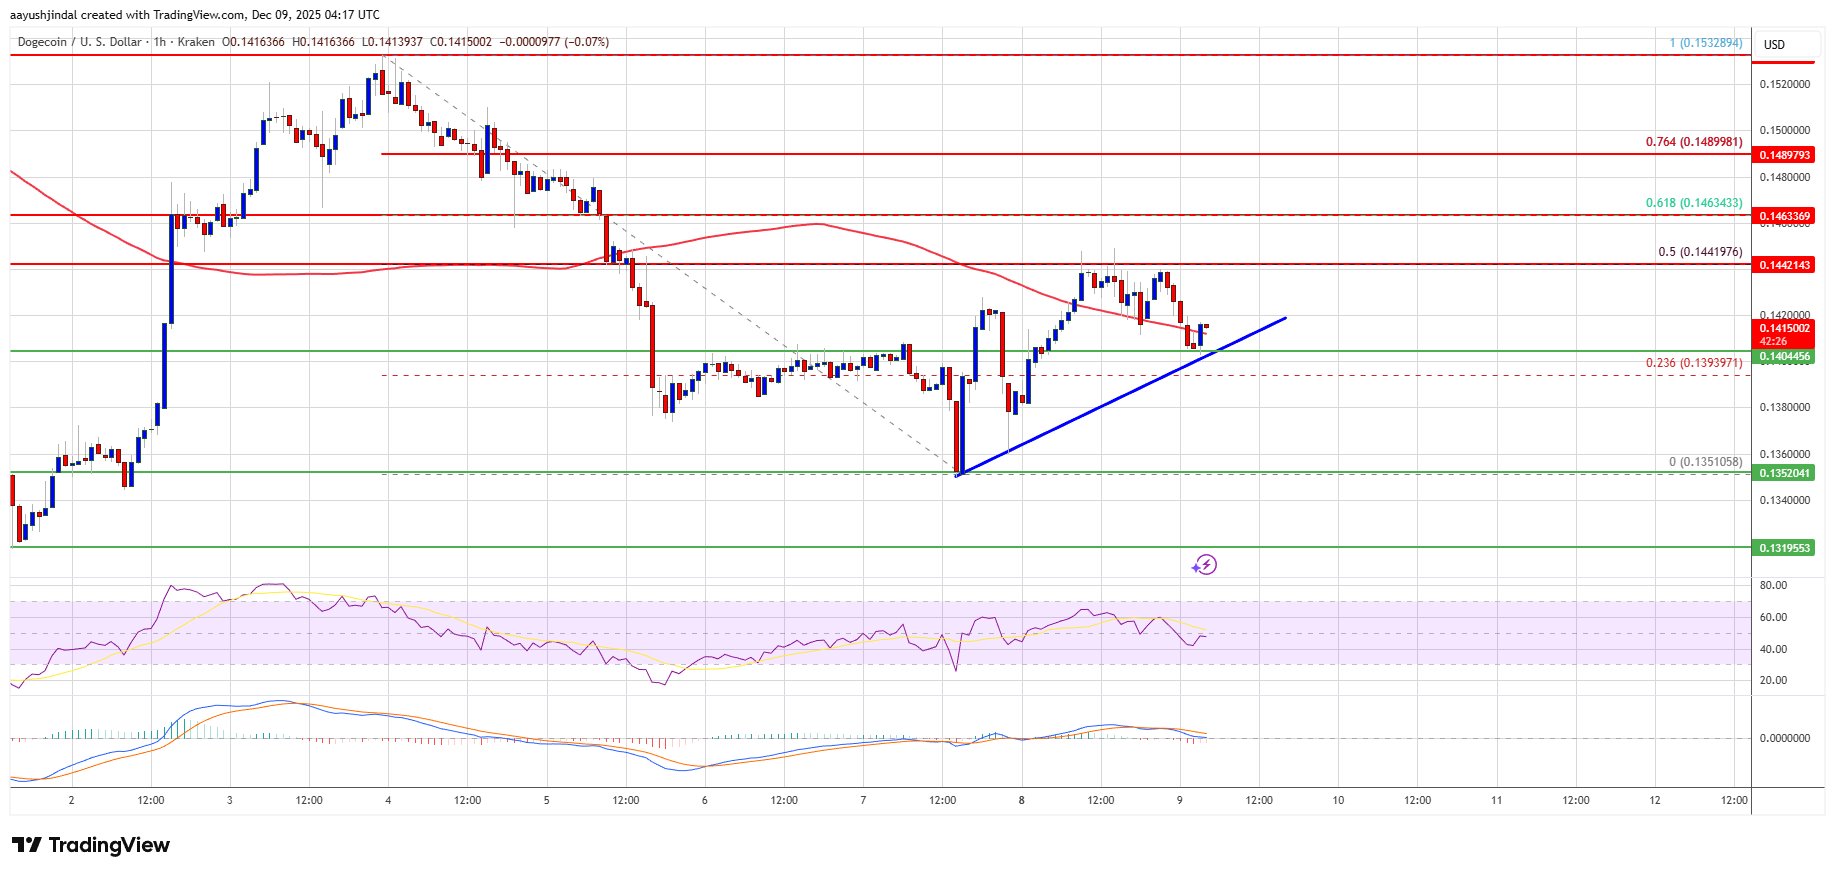
- The price is trading above the $0.140 level and the 100-hourly simple moving average.
- There is a bullish trend line forming with support at $0.1405 on the hourly chart of the DOGE/USD pair (data source from Kraken).
- The price could extend losses if it stays below $0.140 and $0.1380.
Dogecoin Price Faces Resistance
Dogecoin price started a recovery wave from the $0.1350 zone, like Bitcoin and Ethereum. DOGE climbed above the $0.1380 and $0.140 resistance levels.
There was a decent upward move above the 23.6% Fib retracement level of the downward move from the $0.1532 swing high to the $0.1351 low. However, the bears seem to be active near the $0.1440 and $0.1450 levels. Dogecoin price is now trading above the $0.1410 level and the 100-hourly simple moving average. There is also a bullish trend line forming with support at $0.1405 on the hourly chart of the DOGE/USD pair.
If there is a recovery wave, immediate resistance on the upside is near the $0.1450 level and the 50% Fib retracement level of the downward move from the $0.1532 swing high to the $0.1351 low. The first major resistance for the bulls could be near the $0.1490 level.
The next major resistance is near the $0.1530 level. A close above the $0.1530 resistance might send the price toward the $0.1620 resistance. Any more gains might send the price toward the $0.170 level. The next major stop for the bulls might be $0.1720.
Another Decline In DOGE?
If DOGE’s price fails to climb above the $0.1450 level, it could continue to move down. Initial support on the downside is near the $0.140 level and the trend line. The next major support is near the $0.1380 level.
The main support sits at $0.1350. If there is a downside break below the $0.1350 support, the price could decline further. In the stated case, the price might slide toward the $0.1265 level or even $0.1250 in the near term.
Technical Indicators
Hourly MACD – The MACD for DOGE/USD is now losing momentum in the bullish zone.
Hourly RSI (Relative Strength Index) – The RSI for DOGE/USD is now below the 50 level.
Major Support Levels – $0.1400 and $0.1350.
Major Resistance Levels – $0.1450 and $0.1530.


+ There are no comments
Add yours